



The Bureau of Labor Statistics released the September CPI report this morning, and gasoline caused the largest selloff since July. Headline prices rose 0.6% on the month and 3.7% on the year, above the 3.6% consensus and up from 3.4% in August, per Fox Business. The gasoline index jumped 9.1% in one month and sits 34.2% higher than a year ago. The BLS said gasoline accounted for more than half of the September increase which is no surprise as The Strait of Hormuz continues to bleed the world’s oil supply.
CME FedWatch odds of a quarter-point hike at the October 27-28 Fed meeting climbed from 22.1% on Tuesday to 41.5% on Wednesday. Bloomberg’s read put the odds at 46%, according to Charles Schwab. The 2-year Treasury yield added more than 10 basis points to 4.89%, and the Nasdaq fell 1.4% in the first hour.
The Fed’s main tool works on demand and will prove to be less effective at solving this problem due to it being an international crisis. The inflation you feel at the pump comes from a supply shock: tanker attacks in the Strait of Hormuz and a refinery war between Russia and Ukraine. A rate hike can’t reopen a shipping lane or rebuild a Russian refinery, yet traders still have to price one, and that tension is starting to show cracks in the major indexes.
THE CPI REPORT: ENERGY IS DOING THE DAMAGE
The September report tells two stories, I will start with energy. The BLS energy index rose 5.2% in September and 20.4% over twelve months. Airline fares, which track jet fuel, rose 22.4% on the year. Electricity climbed 4.4% and piped utility gas rose 5.0%, per the US Inflation Calculator breakdown of the BLS data.
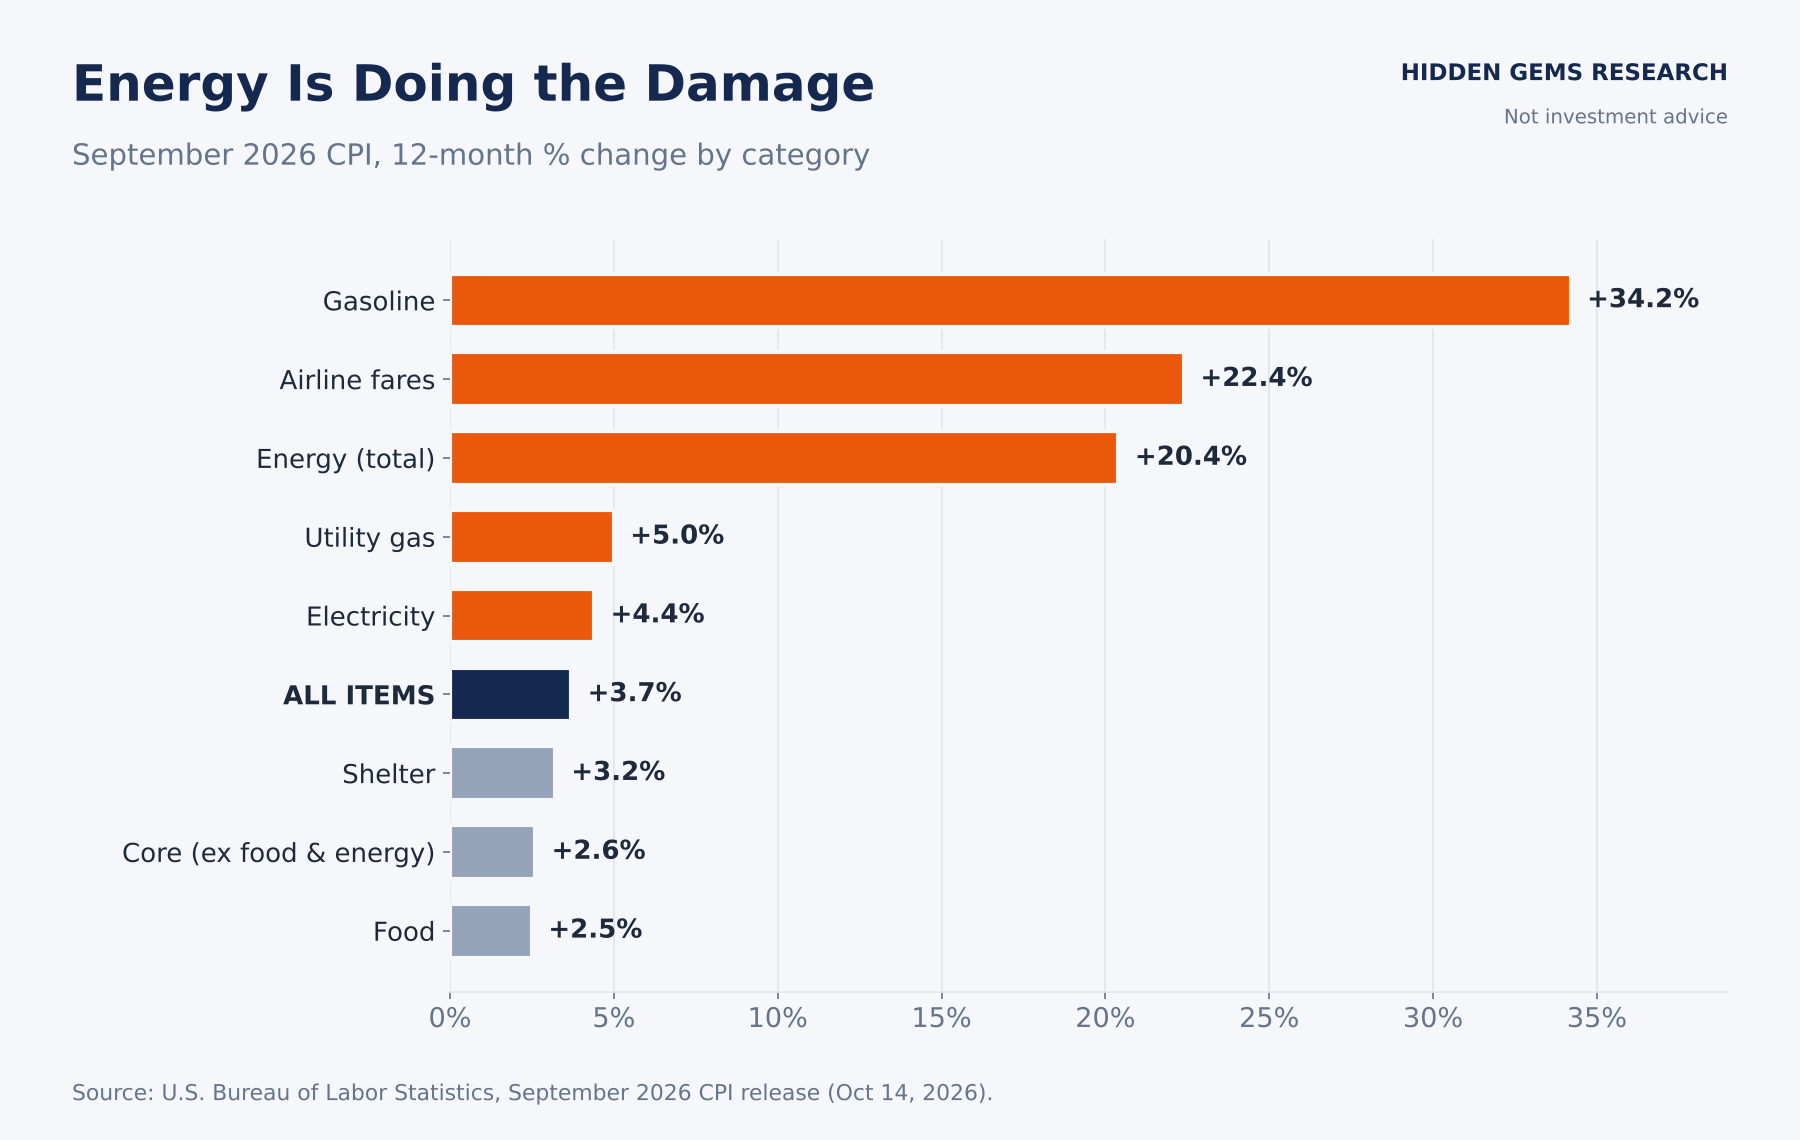
The second story worries the Fed more. Core CPI, which excludes food and energy, rose 0.3% for the second straight month and hit 2.6% on the year against a 2.5% forecast. Schwab’s Collin Martin noted that two straight 0.3% core prints push the three-month annualized rate to 3.4%. Core services rose about 0.4%, led by shelter, with recreation, education, airfares, and medical care also moving higher. Omair Sharif of Inflation Insights called the surprise “broad-based” in comments to Reuters via BNN Bloomberg.
Fuel costs leak into core prices through freight and airfares. Carson Group’s Sonu Varghese told Kiplinger that “we’ve yet to see the full impact of higher diesel prices and the AI boom.” Harris Financial Group’s Jamie Cox used five words: “Inflation is cooking with gas.”
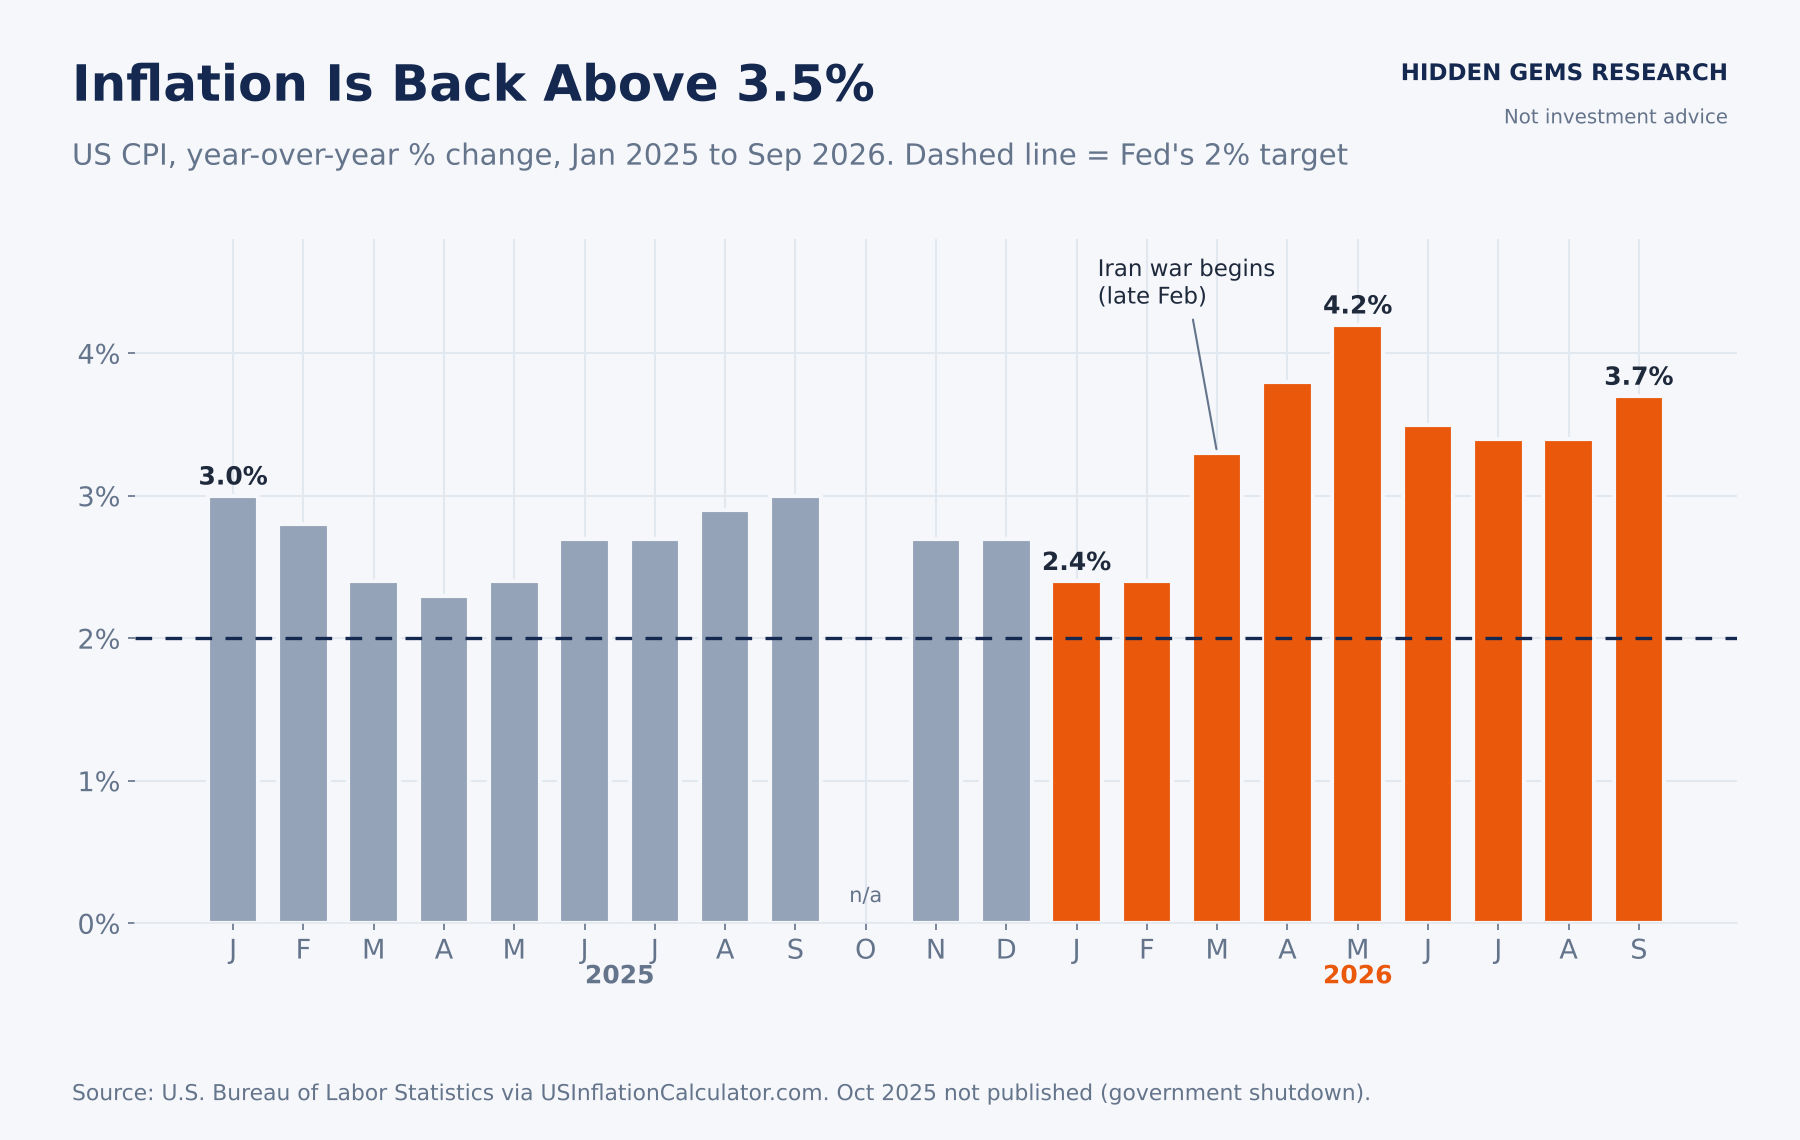
CPI sat at 2.4% in January and February. The US and Israel struck Iran at the end of February, and inflation jumped to 3.3% in March, 3.8% in April, and 4.2% in May. A spring truce cooled it to 3.4% by July, and the second wave of the oil shock has pushed it back up since.
THE POWER BILL KEEPS CLIMBING
Gasoline grabs the headlines, but your power bill moves slower and sticks longer. The EIA’s October Short-Term Energy Outlook projects the average US residential electricity price at 18.2 cents per kilowatt-hour in 2026, up from 17.3 cents in 2025, with 18.7 cents penciled in for 2027, per the EIA. The agency expects wholesale power across the US to rise 11% this year.
The PJM grid serves more than 67 million people across 13 states and Washington, D.C., and it is taking the worst hit. The EIA expects PJM wholesale prices to rise 41% in 2026, the largest jump of any region it tracks, according to 24/7 Wall St. PJM’s market monitor named data center load growth as “the primary reason” for current capacity market conditions, and the EIA expects record US power use in 2026 and 2027.
Brent fell about $37 between mid-May and late June on truce headlines. Power prices tied to AI data centers and multi-year capacity auctions don’t reverse nearly as hard. That leaves the Fed a second inflation source its hikes can’t reach, and it hands utilities and power producers a demand runway that outlasts the war at the expense of the consumer.
THE OIL SHOCK: HORMUZ, HOUTHIS, AND A REFINERY WAR
Brent crude settled at $106.06 on October 14, up more than 70% for the year, per Rigzone. European refiners paid closer to $130 for Dated Brent cargoes as they scrambled for local supply.
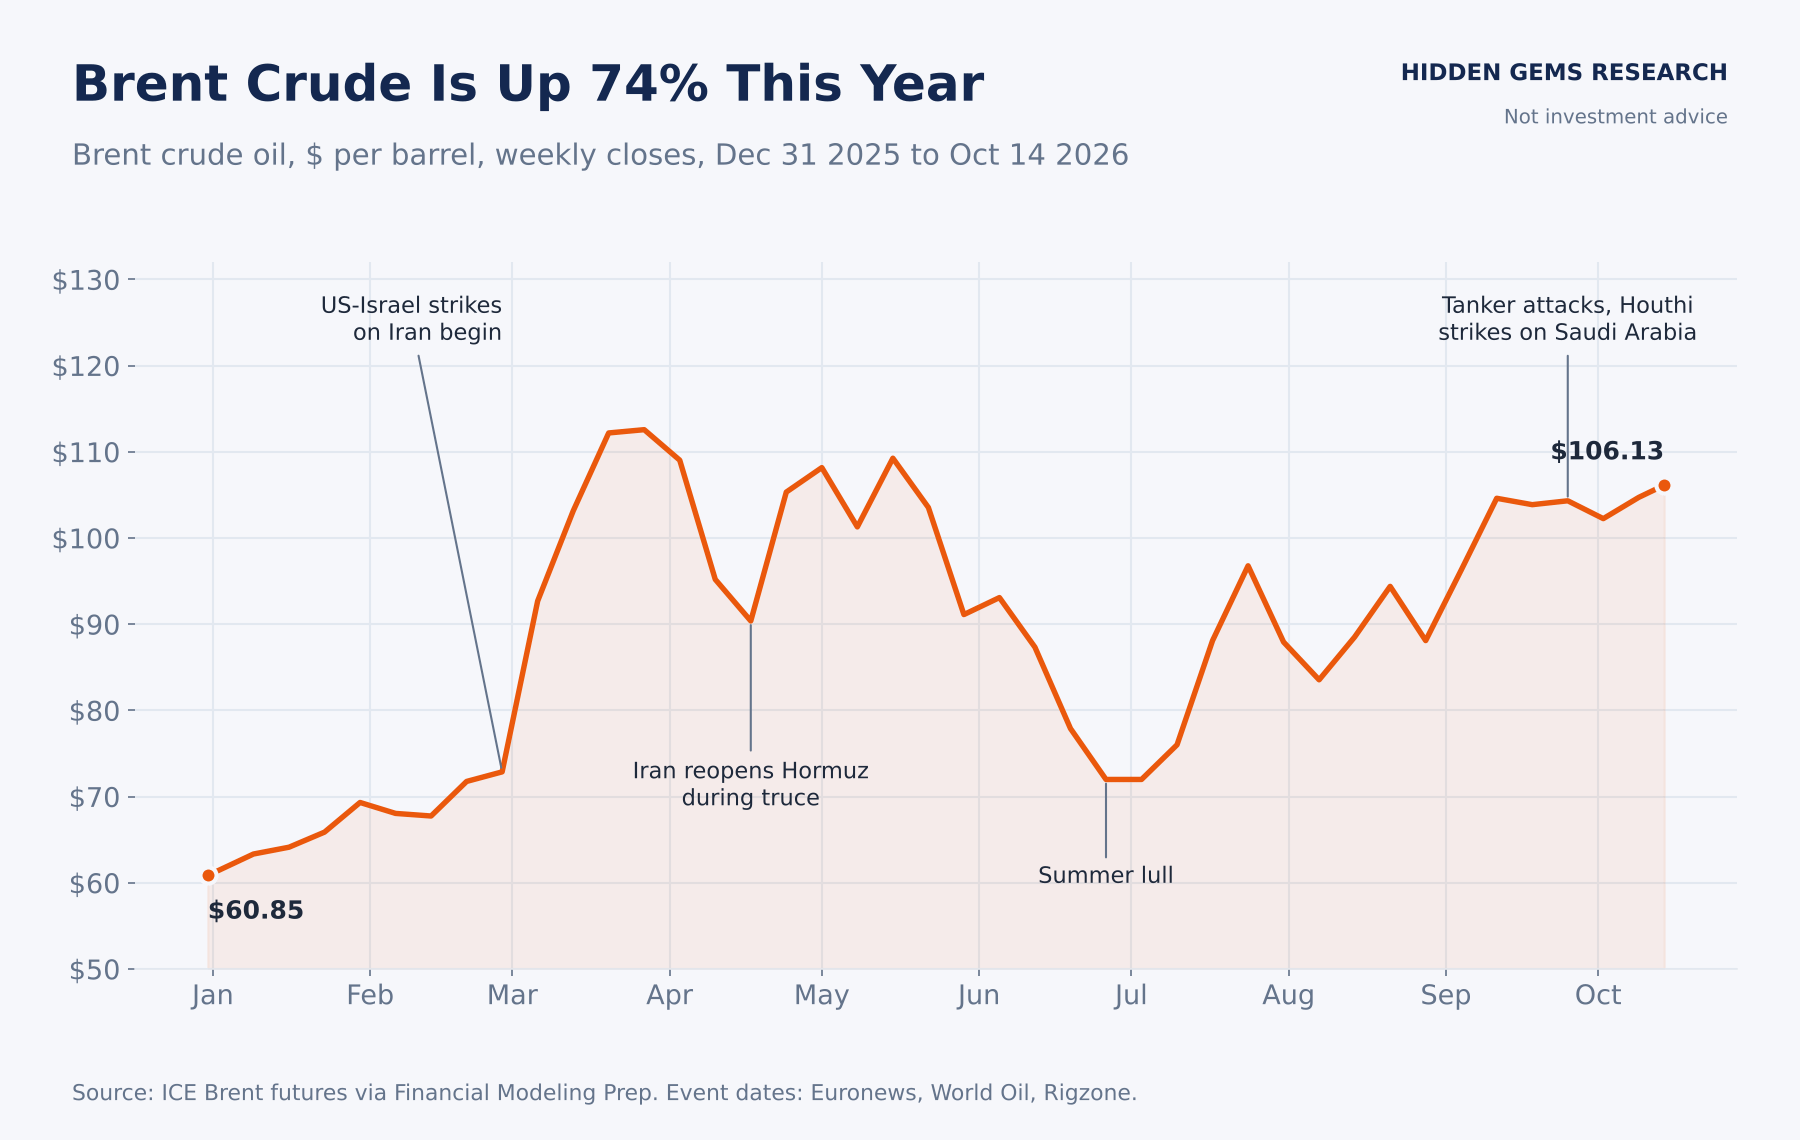
The chart shows two waves. Brent ran from $72.87 to above $112 in March after the US and Israel struck Iran and tanker traffic through Hormuz froze. Iran reopened the strait during an April truce, per World Oil, and Brent bottomed near $72 in late June. The second wave started in July. Iranian forces stepped up attacks on Hormuz tankers, and a container ship sank in the waterway this week. Houthi rebels hit Saudi Aramco’s headquarters in Dhahran and fired on Riyadh’s main airport, according to Fox News, which counted 10 attacks on ships in a single week.
Diesel carries the heaviest load and is causing major problems across multiple industries due to the shortage. The national average hit a record $6.53 per gallon on September 22 and sat at $6.28 on October 8, up from $3.68 a year earlier, per RVtravel. Regular gasoline averaged $4.36, the first October on record with the national average above $4. The IEA warns that diesel shortages could last into 2027, after diesel refining margins hit a record near $95 a barrel in September.
Russia and Ukraine add a second front to the fuel war. Ukraine says it has knocked out about half of Russia’s refining capacity, and European diesel prices have more than doubled this year, according to Al Jazeera. President Trump answered with two moves last week. He struck a deal with Vladimir Putin to bring Russian diesel back to global markets, starting at 300,000 tonnes in October and scaling to 1 million tonnes in December, with sanctions on Russian oil products suspended until April 2027. Then he announced an “energy ceasefire” on Sunday, and Ukraine paused its refinery strikes monentarily.
Russia struck three days later. A missile and drone barrage before dawn Wednesday damaged at least 26 Ukrainian power facilities and left 600,000 people without electricity, per ABC News. Volodymyr Zelenskyy said Russia targeted infrastructure “covered by the ceasefire announced by the American President.” He had already called the diesel deal a gift to Putin, and the rift between Washington and European capitals keeps widening and puts further pressure on foreign policy and global energy stabilization.
The G7 agreed on October 2 to release 100 million barrels from strategic reserves. Energy analyst Kostis Stambolis told Al Jazeera the world still runs about 5 million barrels a day short of pre-war supply. At that pace, the release covers about 20 days of the gap. The Gulf has to reopen for the shortage to close or the Stock Market will continue to breakdown.
THE FED IS HIKING INTO A SUPPLY SHOCK
The Fed raised rates 25 basis points on September 16, its first hike since July 2023, in a 12-0 vote that lifted the target range to 3.75%-4.00%, per Euronews. The statement said inflation “remains elevated” and promised that “the Committee will deliver price stability.” Twelve of 18 officials projected one more hike before year-end, and four saw two.
Fed Chair Kevin Warsh set the tone at Jackson Hole in August, when he said he’d be “hard pressed to describe broad financial conditions as restrictive.” New York Fed President John Williams told Bloomberg this week that one more hike this year looks appropriate, with no need for another in 2027. JPMorgan Asset Management expects three hikes in this cycle, counting September’s, according to its 4Q 2026 asset allocation views.
Fed watchers split on October 28. Franklin Templeton’s Jeff Schulze told Kiplinger that September’s data falls short of what the Fed needs for back-to-back hikes, and that “the bond market has been doing some of the heavy lifting for the Fed.” PPHC’s Martin Beck pointed to weaker jobs data and fragile consumer sentiment as reasons the Fed can hold. Crewe Advisors’ Dustin Thackeray sees September as “a start rather than a final move.”
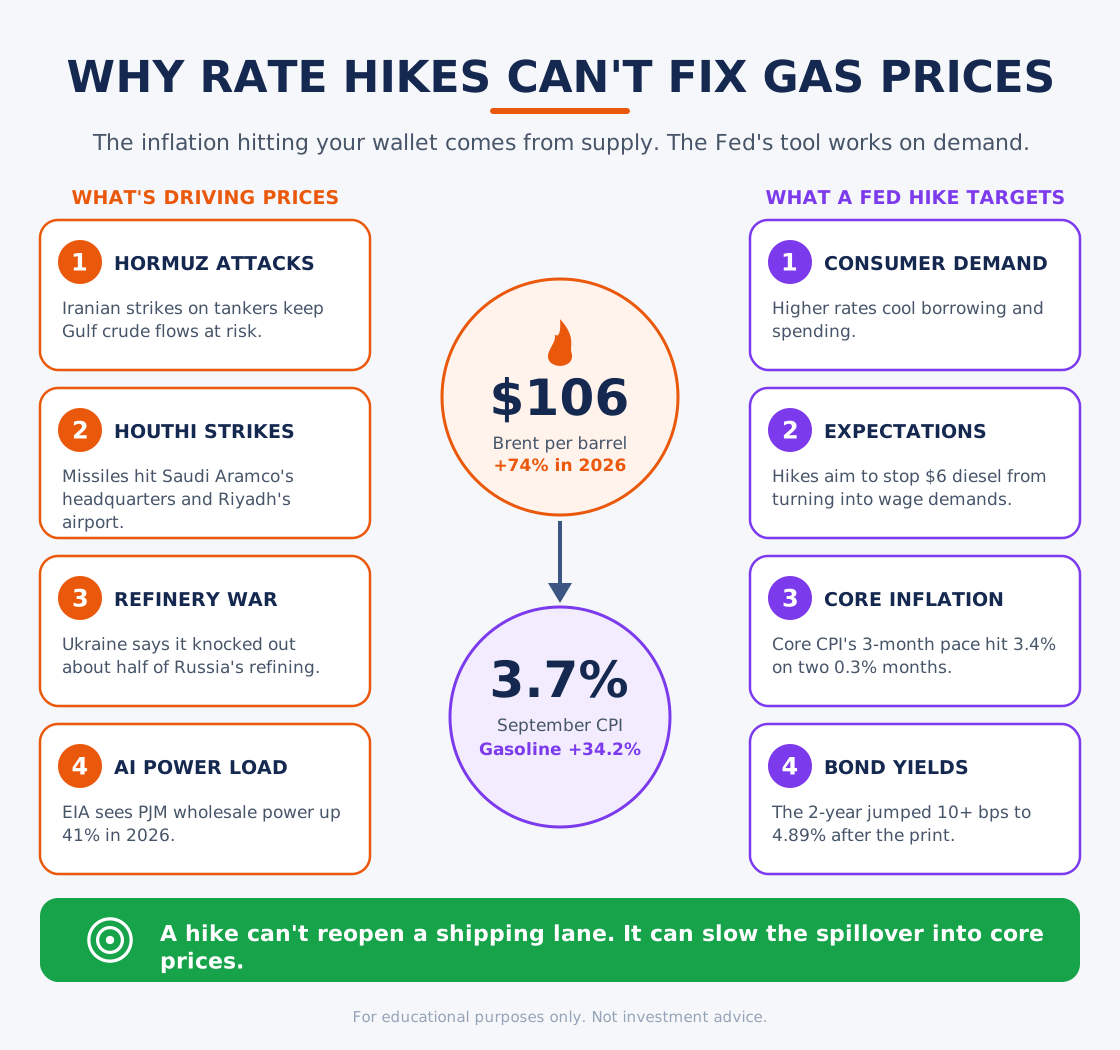
A hike won’t lower the price of a gallon of diesel. The Fed hikes to stop $6 diesel from turning into bigger wage demands and permanent price increases on menus and freight contracts, and core CPI’s 3.4% three-month pace gives the hawks their argument. A hike into a supply shock also squeezes consumers who already spend more on fuel and power. That raises the odds the Fed overtightens right as oil turns lower.
TREASURY YIELDS AT 5%: THE SILENT HARBINGER
I believe treasury yields carry more weight for stock valuations than any other financial data point. The 10-year Treasury yield touched 5.36% intraday on October 7, its highest level since 2002, per The Motley Fool via Yahoo Finance. Treasury Department data shows the 10-year closing at 5.21% on October 13, up from 4.24% in mid-January. Schwab had the 10-year back near 5.30% this morning after the CPI release.
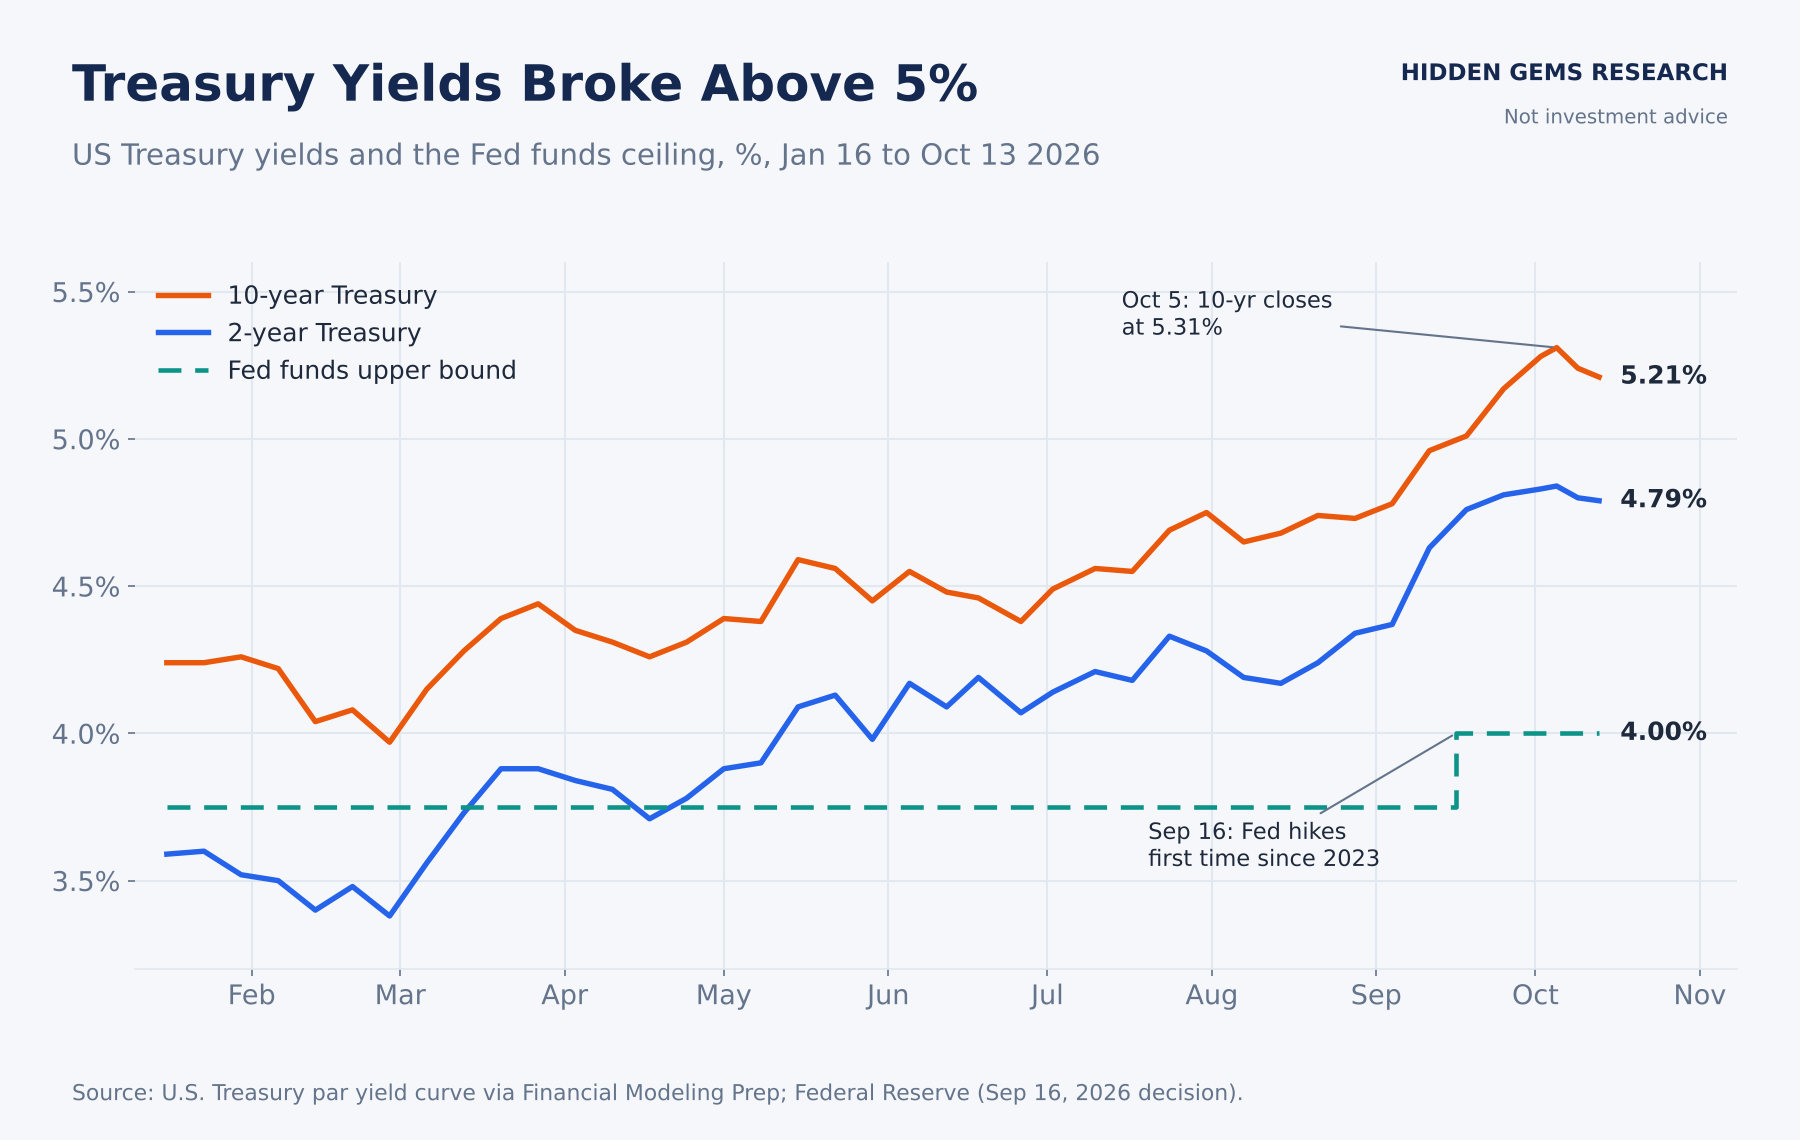
Two forces push yields higher at once. The 2-year tracks Fed expectations, and it climbed from 3.38% at the end of February to 4.79% as traders priced a hiking cycle. The long end carries a second load. The 10-year term premium, the extra yield investors demand to hold long bonds, hit its highest level in more than a decade this month, according to Schwab. Goldman Sachs Asset Management expects long-end yields to stay elevated on loose fiscal policy and AI-related debt issuance, and it notes that hyperscalers have raised about $400 billion in investment-grade debt this year. GSAM’s 4Q 2026 Market Know-How wrote that “the era of central bank yield suppression appears to be firmly behind us.”
FactSet’s October 9 Earnings Insight puts the S&P 500 forward P/E at 19.1, equal to its 10-year average. Flip that P/E and you get a forward earnings yield of about 5.2%, the same as the 10-year Treasury. You collect almost no extra expected return for owning stocks over a government bond. JPMorgan Asset Management flagged a related pattern: once inflation runs above 3%, stocks, government bonds, and credit tend to sell off together.
Earnings give the bulls their counterweight. FactSet expects Q3 S&P 500 earnings to grow 29.6% year over year on 12.4% revenue growth, with energy at 121% and technology at 65%. Pair 30% earnings growth with a falling 10-year and stocks have room to rerate higher. A 10-year at 5.5% would compress multiples even with strong profits.
WHAT THE INSTITUTIONS ARE BUYING
Headlines show you what scared traders this week. Fund holdings show you what managers did about it. TraderMatrix diffs the daily holdings files of 145 active ETFs, covering 10,207 positions, so you see manager moves the day after they happen. A 13F filing shows the same move 45 days after quarter-end.
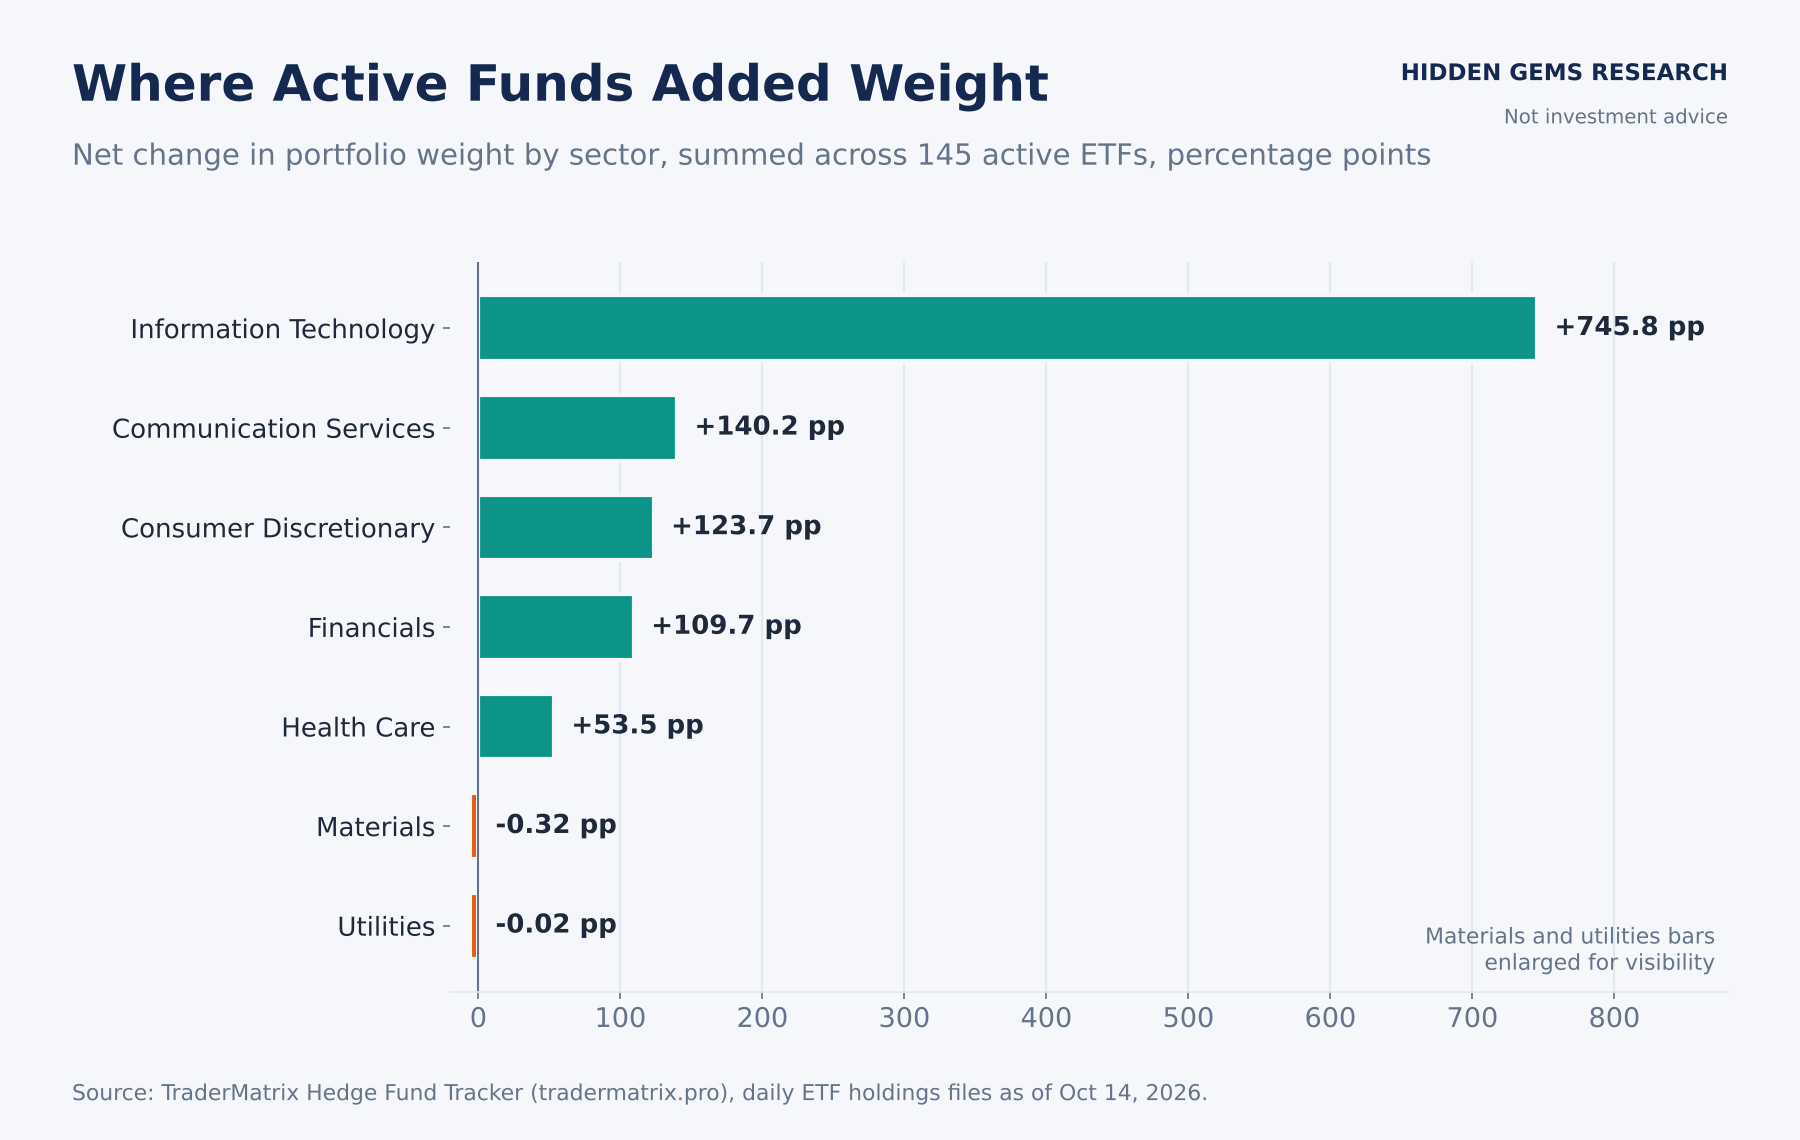
Source: TraderMatrix Hedge Fund Tracker.
The latest files, dated October 14, point to tech. The funds TraderMatrix tracks added a net 745.8 percentage points of weight to information technology, summed across funds. Communication services (+140.2) and consumer discretionary (+123.7) came next, ahead of financials (+109.7) and health care (+53.5). Materials and utilities gave up a sliver of weight. Six separate fund families bought Microsoft and six bought AMD, while five bought Apple and four each added Nvidia and Amazon.
Line that up against 2026 sector returns and two signals stand out. Managers kept adding to tech, the second-best sector of the year at +36.8%, and they bought consumer discretionary, the worst at -5.3%. The discretionary bet pays off if fuel prices and yields come down, the same setup behind the de-escalation path we map for paid subscribers below. Read the data with one caveat. Many of the tracked funds run covered-call and option-income strategies, so part of the weight shift reflects rebalancing and option rolls more than fresh conviction. Treat the flows as a map of where managers want exposure, and confirm with price. That being said, this could be a strategic buy after a record red day. They definitely have more data than the average retail investor.
If you want to run these screens yourself, from sector flow to unusual options activity, you can start with TraderMatrix here.
🔒 PAID SUBSCRIBER SECTION: THE MIDTERM PLAYBOOK, GOLD, BITCOIN, AND THE SECTORS WE WANT
Below the line: how the midterms could flip this market bullish, where gold and Bitcoin go from here, and the sectors we want on each of four paths. We caught $ONDS at $0.67 before it ran +2600%, $LPTH at $4 before it ran +440%, and $UMAC at $7 before it ran +340%. Subscribe so you don’t miss the next one.
