


Since starting 2026, the stock market has been on a turbulent path and the waters arent getting any smoother. In this article I will lay out what I think will happen for the rest of the year and why I think we will see some amazing opportunities as we get closer to November.
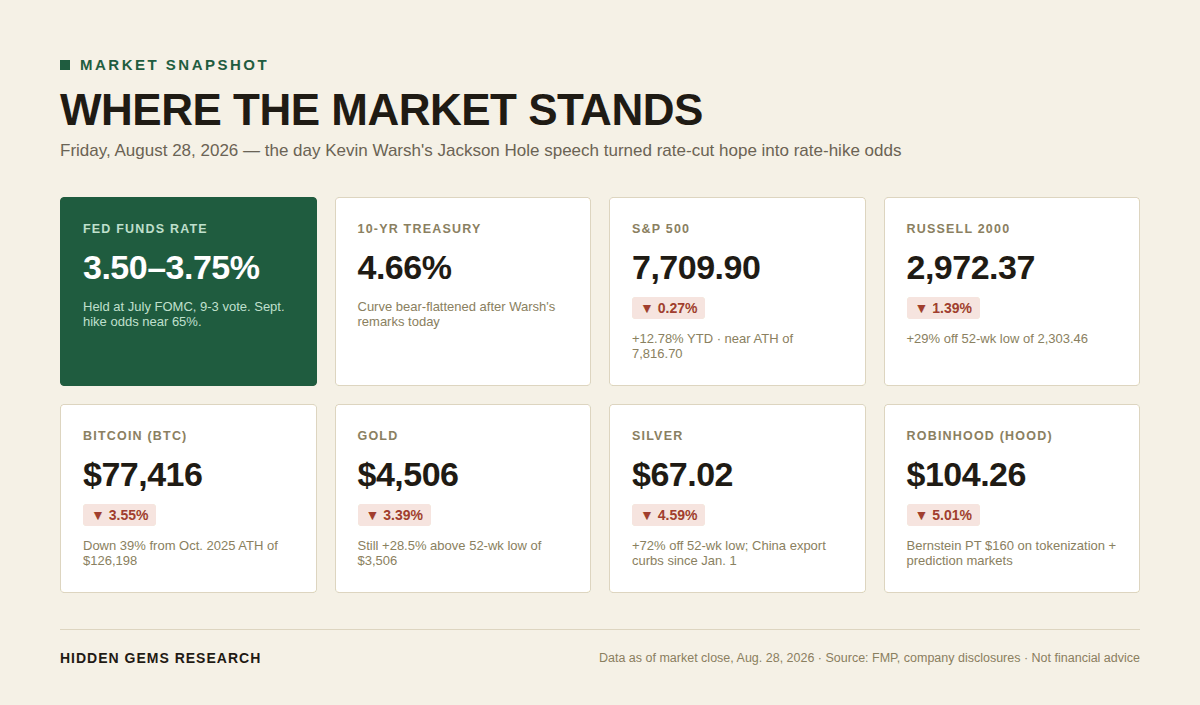
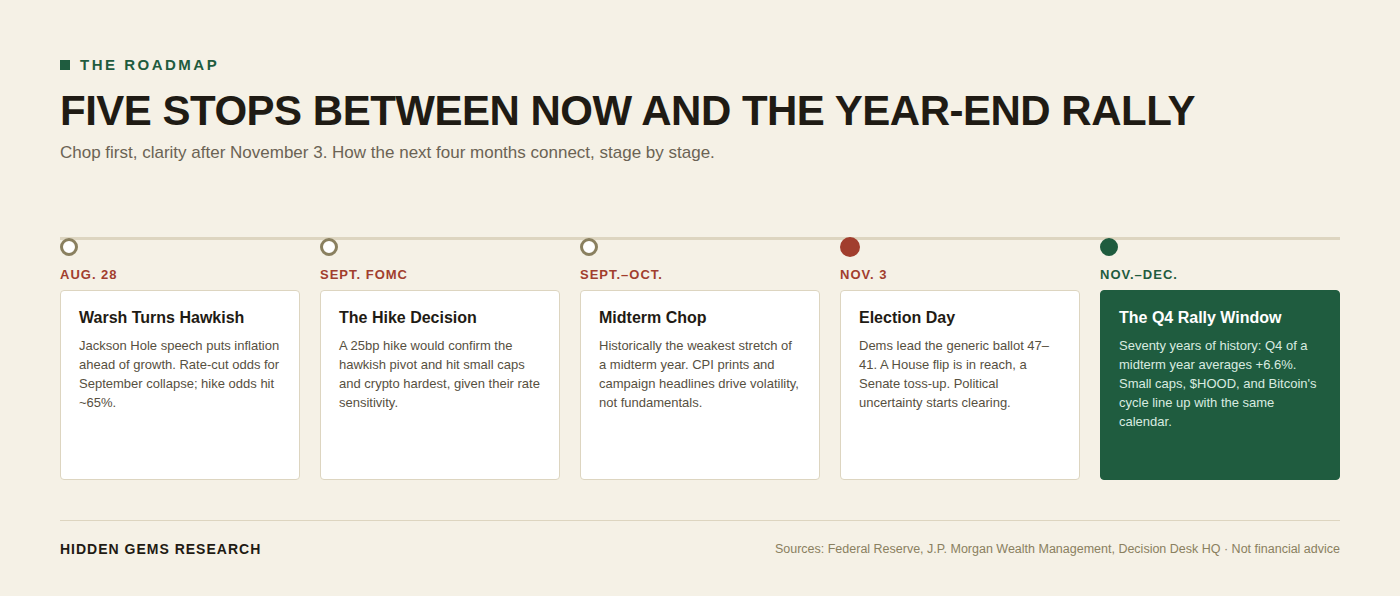
Fed Chair Kevin Warsh told the Jackson Hole crowd this morning that inflation is running above the Fed’s 2% target. “The Fed’s predominant focus right now should be on prices,” he said. Two-year Treasury yields jumped 8 basis points within minutes, gold fell 2.9%, and Bitcoin dropped 3%. The Russell 2000 gave back 1.2% before lunch. The market spent the summer pricing in rate cuts, and the man running the Fed sharply pivoted from an approach with rate cut pressures to one where guidance was no longer given. This, on top of midterms, has created a very bearish macro outlook in the short term but most investors are missing what the data supports happening next. First, a nervous, headline-driven run into Election Day. Then a setup that has shown up in every midterm year for seventy years, one that rarely gets discussed until it’s already underway. The Fed fight happening inside the FOMC right now, the full historical record on midterm years rather than the average alone, the Bitcoin cycle debate splitting Wall Street’s biggest names, and the fintech, small-cap, natural gas, software, and metals trades that connect them all feed the same conclusion. Lets dive in!
THE FED CHANGED THE STORY
Kevin Warsh took over as Fed Chair on May 22, 2026, confirmed by the Senate 54-45, the narrowest margin in the Fed chair’s history. He is a hawk, installed to prioritize price stability after years of Fed critics arguing the previous regime let inflation run too hot for too long. He inherited an economy still working through the aftershocks of the February-to-April conflict with Iran, which shut the Strait of Hormuz for weeks and sent Brent crude to $112 a barrel. Gas prices climbed toward $5 a gallon before a ceasefire brought oil back down. WTI crude sits around $83 a barrel today, well below the war peak but still elevated against the $65-70 range it traded in before the strikes. Aside from existing tariffs, this is the main inflation concern that Warsh is fighting: a supply shock still working its way through year-over-year comparisons that doesn’t respond to a rate move the way an overheating economy would.
The Fed held rates at 3.50%-3.75% at its July 29 meeting, but the vote divergence tells the real story. Three regional presidents (Cleveland’s Beth Hammack, Minneapolis’s Neel Kashkari, and Dallas’s Lorie Logan) dissented in favor of an immediate hike, the most hawkish FOMC vote in nearly a decade. All three pointed to the same risk: five years of above-target inflation creating the danger that elevated price expectations become embedded in wage negotiations and business pricing decisions. Logan argued rates should move “modestly” higher now rather than later. Warsh embraced the split instead of downplaying it. “I asked for a good family fight, and I got one,” he told reporters, before summing up where the committee stands: “This is a period of watchful thinking, not watchful waiting.” Watchful waiting would mean the Fed is on hold and leaning toward cuts once data allows it. Watchful thinking means every option, hike included, stays on the table until the data forces a decision.
J.P. Morgan Wealth Management now puts the odds of a 25 basis point hike at the September meeting near 65%, up from near zero a month ago. Warsh’s Jackson Hole remarks today confirmed why: he’s more worried about looking soft on inflation than about a labor market that’s already showing cracks. Bond traders read him right. Yields on the short end jumped harder with traders now expecting tighter policy soon rather than later. The 10-year sits at 4.66%. Cash and short paper pay close to 3.8%. The market does not like uncertainty and with midterms looming I believe the market will drive lower.. for now.
THE MIDTERM PATTERN NOBODY’S PRICING RIGHT
Many outlooks skip the year-by-year record and quote only the average, for these midterms, its important we zoom out. J.P. Morgan’s research desk pulled S&P 500 returns across every midterm election year going back decades, and the quarterly pattern holds up. The first three quarters of a midterm year average small negative returns: -0.5% in Q1, -0.6% in Q2, -0.1% in Q3. Then the fourth quarter jumps an average of 6.6%. J.P. Morgan’s strategists attribute the shift to fading political uncertainty. Investors stop discounting an unknown outcome once the outcome is known, and the rally tends to start about a month before Election Day itself.
Behind that average, the full-year numbers look messier and more useful: 1994 finished down 1.5%; 2002, in the teeth of the dot-com unwind, down 23.4%; 2010 up 12.8%; 2014 up 11.4%; 2018 down 6.2%; and 2022, with the Fed hiking into a bear market, down 19.4%. The average across midterm years since 1950 sits around +4.6%, but that average hides two very different regimes: years where the Fed and macro backdrop cooperate (2010, 2014) and years where they don’t (2002, 2018, 2022). The regime 2026 falls into depends almost entirely on what Warsh does in September, which is why the Fed section above isn’t a separate story from this one.
Fear not as a strong rally is in the cards, backed by data. The S&P 500 has finished higher in the twelve months following every single midterm election since 1950, nineteen for nineteen. however, the magnitude of the moves vary widely. The year after 1994 delivered 34.1%, the year after 2002 delivered 26.4%, the year after 2010 came in flat, and the year after 2014 was the lone soft spot at -0.7%. The years after 2018 and 2022 delivered 28.9% and 24.2%. Even the weakest post-midterm stretches on record land near breakeven, not negative. Mid fall should mark the bottom of a dramatic year as the inklings of a rally start to form. There are some factors we need to consider.
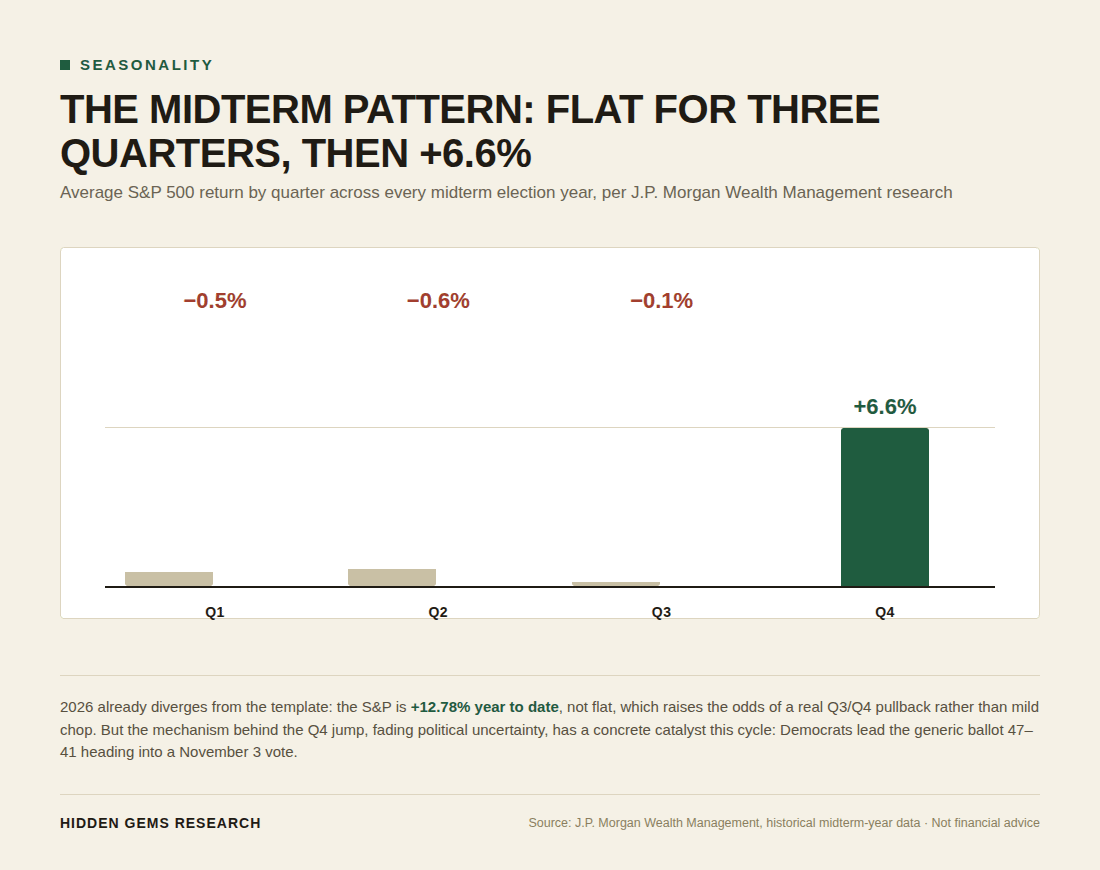
Two things make 2026 different from the historical template, one bearish and one bullish. The bearish difference: the S&P 500 has already gained 12.78% year to date, sitting near its all-time high of 7,816. Previously seasonal rallies have started on a flat-to-negative setup, which raises the odds of a short-term pullback in September and October rather than the mild chop history shows. A market that’s already expensive going into a hawkish Fed decision has more room to fall than a market that’s already priced in disappointment. The bullish difference: Democrats now lead the generic congressional ballot by 6 points, 47% to 41%, according to Decision Desk HQ’s August tracking, up from a 4-point lead in July. Voters are blaming rising gas prices and the Iran conflict for that shift. With a 6-point edge, Democrats are within reach of a House flip, and Senate control looks like a toss-up, which creates the “uncertainty resolves” mechanism that could lead to a Q4 rally through a trackable catalyst in a regime change plus clearing up uncertainty of who will come out on top.
Put those two pieces together: a market already stretched, a Fed that took cuts off the table, and volatility events (the September FOMC decision, October CPI prints, the final weeks of campaign season) all landing in the same eight-week window. These are the main macro overhangs driving a pullback. After November 3, a different pattern takes over, one the seasonal data has repeated in every midterm cycle for seventy years, and one where the post-election twelve-month record is close to unbroken. Now I watch to touch on some industries that could do well into this upcoming market volatility.
WHAT TENDS TO HOLD UP BEFORE THE VOTE
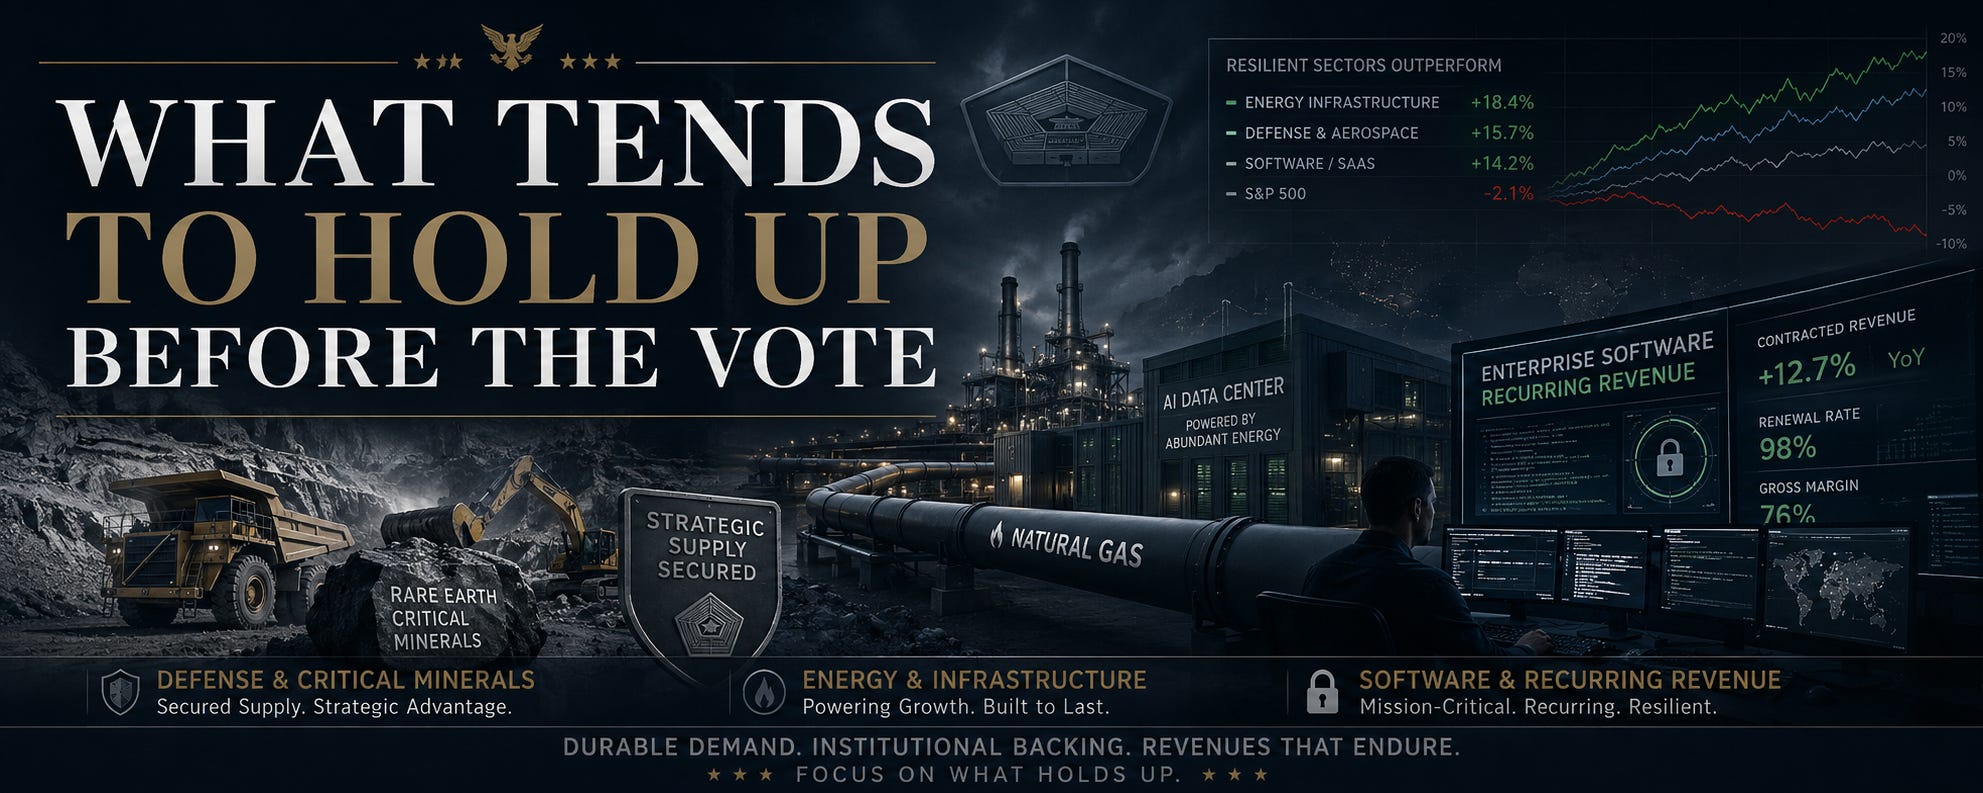
Going into a stretch like this, the names that hold up best carry revenue and backlog that don’t depend on the Fed’s next move. Two things matter most: contracted revenue that gets funded regardless of interest rates, and a government or institutional buyer on the other side of the trade who isn’t shopping around based on the cost of capital.
I expect the broader government-backed critical minerals trade to hold up and catch a strong bid. MP Materials ($MP) has the Pentagon as its largest shareholder after a July 2025 deal that included a price floor on the rare earths MP produces inside the US, plus $110.9 million in additional federal price-protection support disclosed this year. This created a government backstop sitting underneath a stock, which matters a great deal when many other equities in the market are reacting to a single Fed chair’s choice of adjective. A 25 basis point surprise in September becomes somebody else’s problem once the Pentagon is functionally long your stock at a guaranteed floor price.
That same logic extends past defense and critical minerals. EQT Corporation ($EQT), the largest natural gas producer in Appalachia, sits on the acreage Morgan Stanley expects to supply a forecasted 4.8 billion cubic feet a day of new demand from AI data centers by 2030, a buildout funded by hyperscaler capital budgets rather than the Fed funds rate. SentinelOne ($S) also carries the same kind of insulation from a different angle: annual recurring revenue grew 22% year over year to $1.2 billion, with 1,715 customers now paying at least $100,000 a year on contracts that renew on their own schedule regardless of what happens in September.
None of these three names are immune to a broad selloff if the S&P corrects 10% into October. On the other hand, all 3 of these play in a field that can survive a market downturn that is overweight with tech and potentially thrive.
THE BITCOIN CYCLE’S SECOND WIND
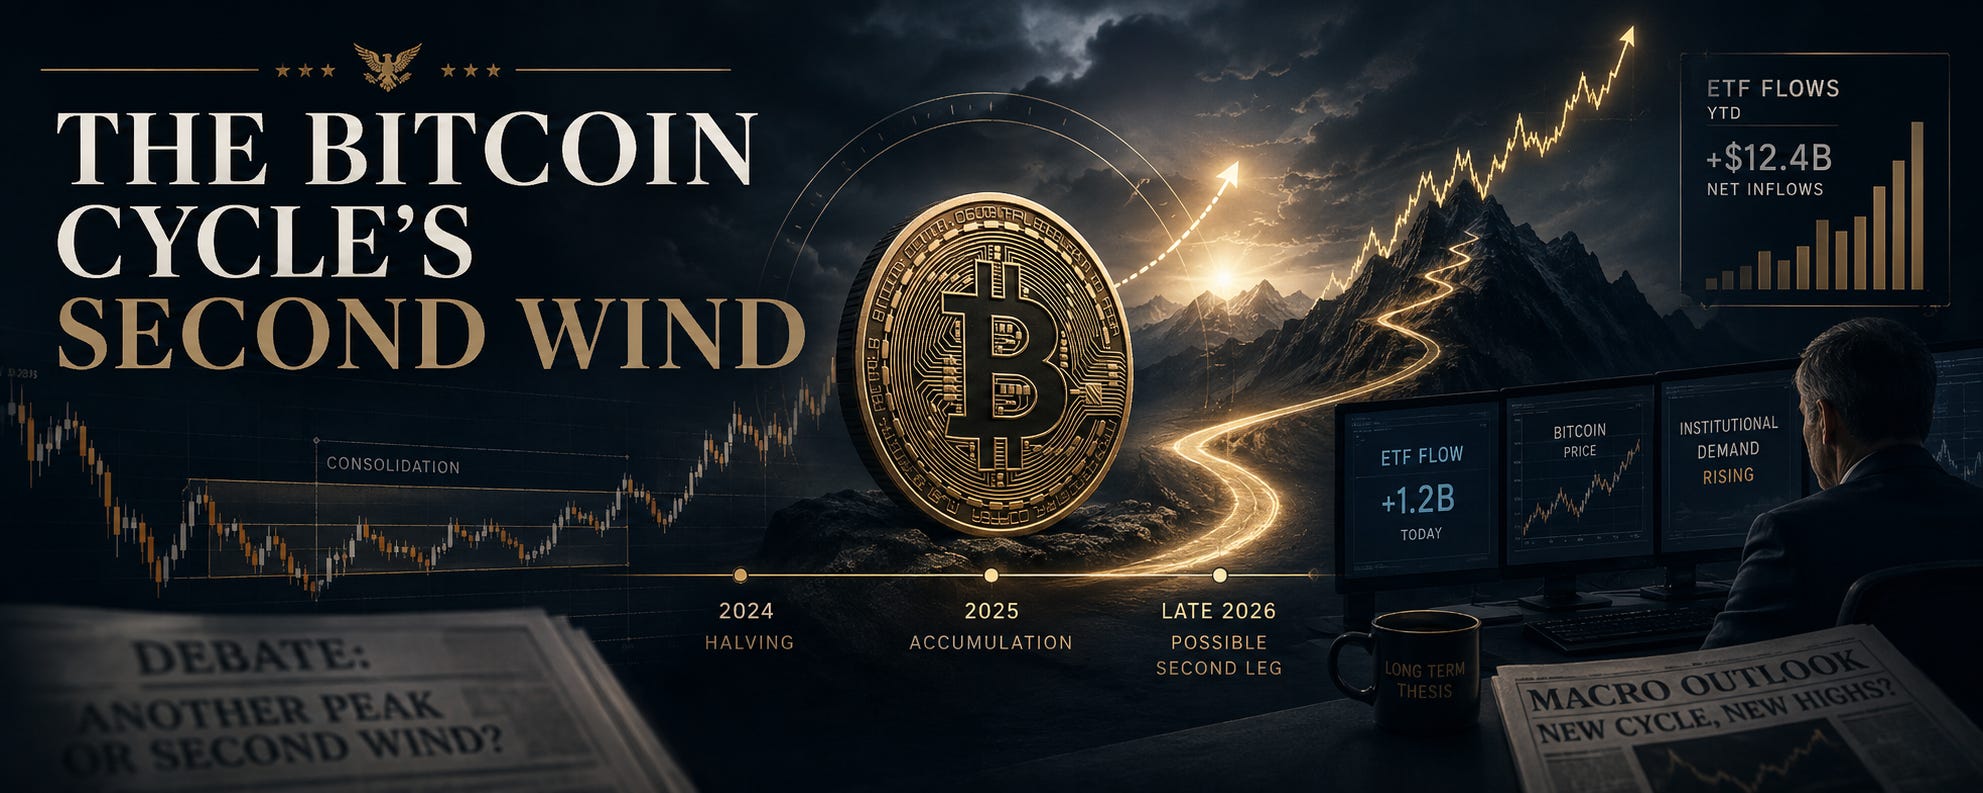
Bitcoin halved its mining reward on April 20, 2024, the fourth halving in the asset’s history, and the three previous halvings all produced the same shape: a price peak arriving 12 to 18 months later, driven by the supply cut working through a market where demand kept growing. The 2012 halving preceded a peak near $1,150 about thirteen months later; 2016 topped near $19,700 about seventeen months out; and 2020 peaked near $69,000 roughly eighteen months after the reward cut. This cycle held to the same rhythm on schedule: Bitcoin hit an all-time high of $126,198 in October 2025, eighteen months after the halving, matching the pattern. It has since fallen to $77,416, down 39% from the peak, with today’s Jackson Hole selloff knocking another 3% off the price.
The debate right now is whether that October peak was the actual cycle top or a mid-cycle shakeout on the way to a second, higher peak. Fidelity’s Jurrien Timmer argues the top is already in and 2026 becomes what he calls a “dormant year,” with downside toward $55,000-$75,000 if his read is correct. Standard Chartered and Bernstein take the other side, projecting $130,000-$150,000 by year-end on the combination of continued institutional inflows, regulatory clarity, and a Fed that eventually has to cut once the Iran-driven inflation spike rolls out of the year-over-year comparisons.
The ETF flow data backs both camps, a sign of how unsettled this question still is. Bitcoin spot ETFs pulled in $853.5 million in net inflows for the week ended August 7, the largest weekly total since mid-April, with BlackRock’s IBIT alone capturing $693 million of it, 81% of the total. That’s a strong signal of institutions potentially dipping back in. But zoom out and the ETF complex is still sitting on $4.5 billion in net outflows year to date, meaning one strong week doesn’t undo months of selling. Compare that to the run that drove the October 2025 peak: between April and October of last year, Bitcoin climbed from around $75,000 to $126,000 on weekly ETF inflows that exceeded $1 billion on multiple occasions. A single $853 million week is a start. It is not yet that kind of run.
Regulation is the other lever. The CLARITY Act, the bill meant to divide crypto oversight between the SEC and CFTC, missed its August voting window in the Senate and is now targeting a vote during the three-week September session before Congress breaks for the midterms. It needs 60 votes, which means winning over close to 10 Senate Democrats, and the sticking points could potentially stall the bill with concerns centered around ethics provisions restricting senior officials, Trump included, from backing crypto projects, plus unresolved stablecoin-yield and illicit-finance rules. Industry lobbyists call passage “doable” if those disputes get resolved in September. If they don’t, the bill likely dies until a new Congress, and the regulatory-clarity leg of the bull case goes with it. Once the bill clears the next crypto rally starts with it, boosting coins and fintech as a whole.
BitMine Immersion ($BMNR), the Ethereum treasury company chaired by Fundstrat’s Tom Lee, is the equity proxy trading with the most leverage to this debate. The company holds 5.85 million ETH, near 5% of total supply, built through an “Alchemy of 5%” accumulation strategy, and the stock swings harder than Bitcoin itself in both directions because it’s a concentrated bet on a single balance sheet in a volatile assett. It’s an Ethereum trade riding on Bitcoin-cycle sentiment: the same risk-on flows that lift Bitcoin tend to lift Ethereum and BMNR alongside it, but the correlation isn’t one to one, and a rotation out of Ethereum specifically would hit BMNR without necessarily hitting Bitcoin. Even with that being the case they should move in tandem if regulations ease and confirmation on government seats are in.
This is all connective tissue in a bigger story: if the oil shock inflation reads roll off by Q4 the way base effects tend to, and if the midterm outcome removes political uncertainty the way it has in every prior cycle, the Fed gets more room to ease exactly when Bitcoin’s own four-year rhythm would be finding a second wind rather than staying dormant. None of that is guaranteed, and the CLARITY Act’s odds look closer to a coin flip than a lock. But the pieces are pointed the same direction on the same calendar, and I like the set up for what could be one of the most surgical rebound trades of the 2020’s.
THE PIVOT TRADE: SMALL CAPS AND FINTECH INTO YEAR-END
Small caps already show what happens when this alignment shows up: they’ve lived through the mirror image of it all year. The Russell 2000 sits at 2,972, up more than 29% from its 52-week low of 2,303 and within 3% of its all-time high, even after today’s hawkish-Fed pullback. The mechanism is straightforward: small-cap companies carry more floating-rate debt than large caps on average, so their interest expense moves with the Fed almost in real time, unlike a mega-cap that termed out its debt at fixed rates years ago. That makes the Russell the single most rate-sensitive corner of the market in either direction. It’s also a different sector mix than the S&P, with heavier weightings in regional banks, industrials, and small emerging tech, none of which benefit from a “higher for longer” Fed the way a cash-rich mega-cap tech balance sheet does. Small caps have already rallied hard on rate-cut hope this year and have also given back heavily on any bearish macro sentiment. A confirmed hike in September would hit them hardest on the way down, and a confirmed pivot back toward cuts in Q4 would send them hardest on the way back up, for the same balance-sheet reason working in reverse.
$ONDS and $UMAC, two names we flagged before they ran 2,600% and 340%, sit in that bucket: small defense-and-drone names, thin enough that any risk-on rotation moves them fast, especially when they are based in one of the hottest sectors. Watch how they trade in the September-October chop (my levels are posted for premium subscribers). What for a late October move on adjacent positions.
Robinhood ($HOOD) is my favorite fintech name to watch for a different mechanical reason: it sits at the intersection of the crypto trade and the retail risk-on trade at the same time. Shares trade at $104.26 today, down 5% alongside Bitcoin’s Jackson Hole selloff, against a 52-week range of $63.52 to $153.86. Bernstein carries an Outperform rating and a $160 price target, built on a thesis that Robinhood has moved past being a trading app, while my target sits much higher, closer to $200, due to their entry into prediction markets and sports betting on top of trading. Robinhood Chain has processed over $12 billion in decentralized exchange volume and 150 million transactions. Its prediction-markets business, run through the CFTC-regulated Rothera exchange, processed 3.5 billion contracts this year, 2.1 billion of them in the second quarter alone, and now generates more revenue than the company’s crypto trading desk, a strong shift in the business mix that is sure to continue expanding as these markets grow. Robinhood Earn has pulled in over $200 million in deposits, and management is building toward tokenized equities and global investing access as the next leg, not just a better trading app. If Bitcoin gets its second wind into year-end and the midterm outcome clears a fog that’s been sitting over risk assets since spring, Robinhood is levered to both halves of that trade at once.
GOLD, SILVER, AND THE INFLATION WILDCARD
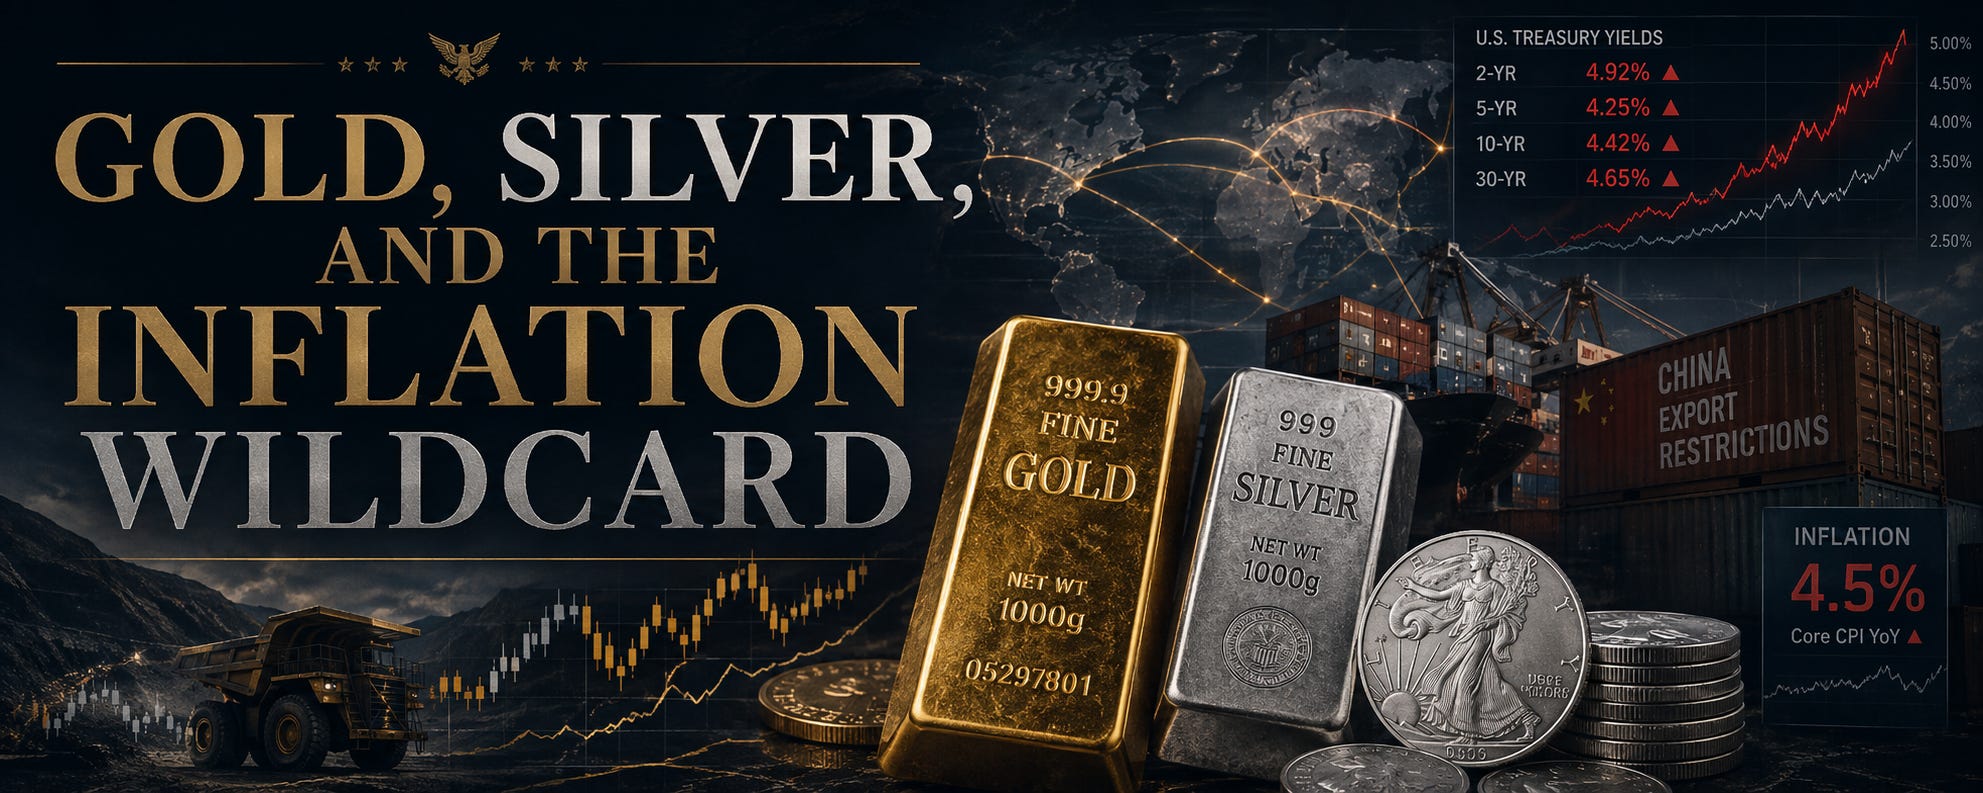
One scenario still unaddressed: Warsh is right, inflation doesn’t cool, and the Fed holds rates higher for longer even as the midterm fog clears. Gold and silver cover that scenario, and it’s the one part of this outlook that works whether the rate-cut story plays out or not as long as they don’t rise again.
Gold sits at $4,506 an ounce today, down from a 52-week high of $5,626.80 but still 28.5% above its 52-week low of $3,506. The SPDR Gold Shares ETF ($GLD) is the simplest way to hold that move directly, trading at $408.89 against a 52-week range of $313.07 to $509.70. Silver has moved even harder: $67.02 an ounce today, after touching a 52-week high of $121.30 and off a 52-week low of $38.91. Part of that silver spike traces back to Beijing. China moved to restrict silver exports effective January 1, 2026, using the same licensing playbook it applied to rare earths and germanium: an 80-ton minimum production threshold that leaves only 44 companies worldwide licensed to export the metal. China controls 70% of the silver traded worldwide, and one commodities analyst covering the restrictions put potential upside at 30% over twelve months if Beijing enforces the rule at full strength.
There’s a second, more recent catalyst stacking on top of the China story. On August 19, the Treasury Department announced it would at least double buybacks of long-dated government debt, the 10-year through 30-year maturities. Bond yields fell on the news (the 10-year dropped 5 basis points to 4.7%, the 30-year fell 8 basis points to 5.2%), and lower long-term yields reduce the opportunity cost of holding a metal that pays no yield of its own. Mining stocks moved far more than the metals themselves, which is the leverage this sector is known for: Hecla Mining ($HL) surged 13% to $20.29 that day after sitting down 6% year to date, Coeur Mining ($CDE) rose 13% to $20.83 after being up only 4% for the year, First Majestic Silver ($AG) climbed to $20.57, and the Amplify Junior Silver Miners ETF ($SILJ) jumped 9% intraday. That’s operating leverage: small metal price moves turn into much larger percentage swings in the equities.
The underlying miner fundamentals back up the move on top of the momentum. Hecla posted record Q3 revenue of $410 million, up 67% year over year, on an all-in sustaining cost near $11 an ounce, among the lowest in the sector thanks to lead and zinc by-product credits, and net leverage has fallen to roughly 0.3x from 1.8x a year earlier. Pan American Silver’s quarter was just as strong: revenue hit a record $884 million, up 24% year over year, after the MAG Silver acquisition added the high-grade Juanicipio mine and pulled AISC down to roughly $15 an ounce. First Majestic more than doubled Q3 silver production to 3.9 million ounces, with revenue nearly doubling alongside it to $285 million. Worth flagging: consensus analyst price targets on these names were set when silver traded closer to $72 an ounce and, in some cases, now sit below the current share prices, which either means the equities have run ahead of where Wall Street models justify or the models haven’t caught up to how fast the metal has moved.
This is a strong setup if rates hold steady into 2027 while inflation stays sticky: a genuine supply squeeze on top of a metal that already serves as an inflation hedge, a bond market response adding a second tailwind on top of it, and a Fed that has told you it’s prioritizing price stability over growth. Gold and silver don’t need a rate cut to work in that scenario. They need a central bank staying tight while prices keep running hot, which is what Warsh described today. MP Materials sits in the same trade for the same reason: a domestic producer with a government backstop, while China keeps turning export licenses into a foreign-policy tool.
WHAT COULD GO WRONG
Warsh’s inflation focus could prove correct, and a September hike followed by a stickier-than-expected CPI print would extend the “no cuts” regime well past the midterms, pushing the Bitcoin and small-cap pivot trade out to 2027 rather than this December. “Watchful thinking” cuts both ways: a committee that hasn’t decided can land on two hikes as easily as zero. The Iran ceasefire is a truce, not a settlement, and any reescalation reopens the Strait of Hormuz risk that drove oil to $112 in March. Timmer’s bear case on Bitcoin, that October 2025 was the actual cycle top and 2026 stays dormant, has real analysts behind it, a market that’s already down 39% from that high, and a year-to-date ETF outflow figure that hasn’t fully reversed to show for it. The CLARITY Act could stall in September exactly the way it stalled in August, taking the regulatory-clarity leg of the crypto bull case off the table until a new Congress convenes. A Democratic wave big enough to flip both chambers could unsettle markets around specific policy fights (drug pricing, tax changes, spending bills) as easily as it could resolve the uncertainty that’s supposed to fuel the Q4 rally. And silver, up 72% from its 52-week low even after the recent pullback, has already made a large move on the China restriction story, with several miners now trading above where analyst models justify. A lot of that catalyst may already be priced in.
THE SETUP, SUMMARIZED
Warsh told you today what he’s optimizing for: prices over growth, at least through September, with a committee split three ways on how far and how fast to act. That sets up a rough stretch into the midterms, with a market that’s already expensive and a Fed that pulled the rate-cut narrative off the table, eight weeks of election-season headline risk still ahead. But the seasonal pattern behind midterm Q4 rallies has held for seventy years, the post-election twelve-month record is nineteen for nineteen since 1950, the generic ballot points toward the kind of decisive outcome that has triggered the pattern before, and Bitcoin’s four-year rhythm lines up with the same calendar window. Own the names with backlog and government backing through the chop, and watch the small caps and Robinhood for the moment sentiment turns. Keep gold, silver, and the miners in the mix regardless, because that trade doesn’t need the Fed to cooperate.
Disclosure
The information provided in this publication is for educational and informational purposes only. Nothing in this content should be interpreted as a recommendation, solicitation, or offer to buy or sell any security. I do not provide personalized investment advice or individualized recommendations. All examples, tickers, scenarios, and analyses are strictly for general educational discussion.
The views expressed are my own and do not represent the views, policies, or recommendations of any employer, broker-dealer, or affiliate. Any securities referenced are used solely as case studies to demonstrate research methods and analysis frameworks.
Investing involves risk, including the potential loss of principal. You are solely responsible for your own investment decisions. Consult a licensed financial professional for personalized guidance.
So October likely to be bloody red?
Fantastic article. Thank you for sharing 🙏