


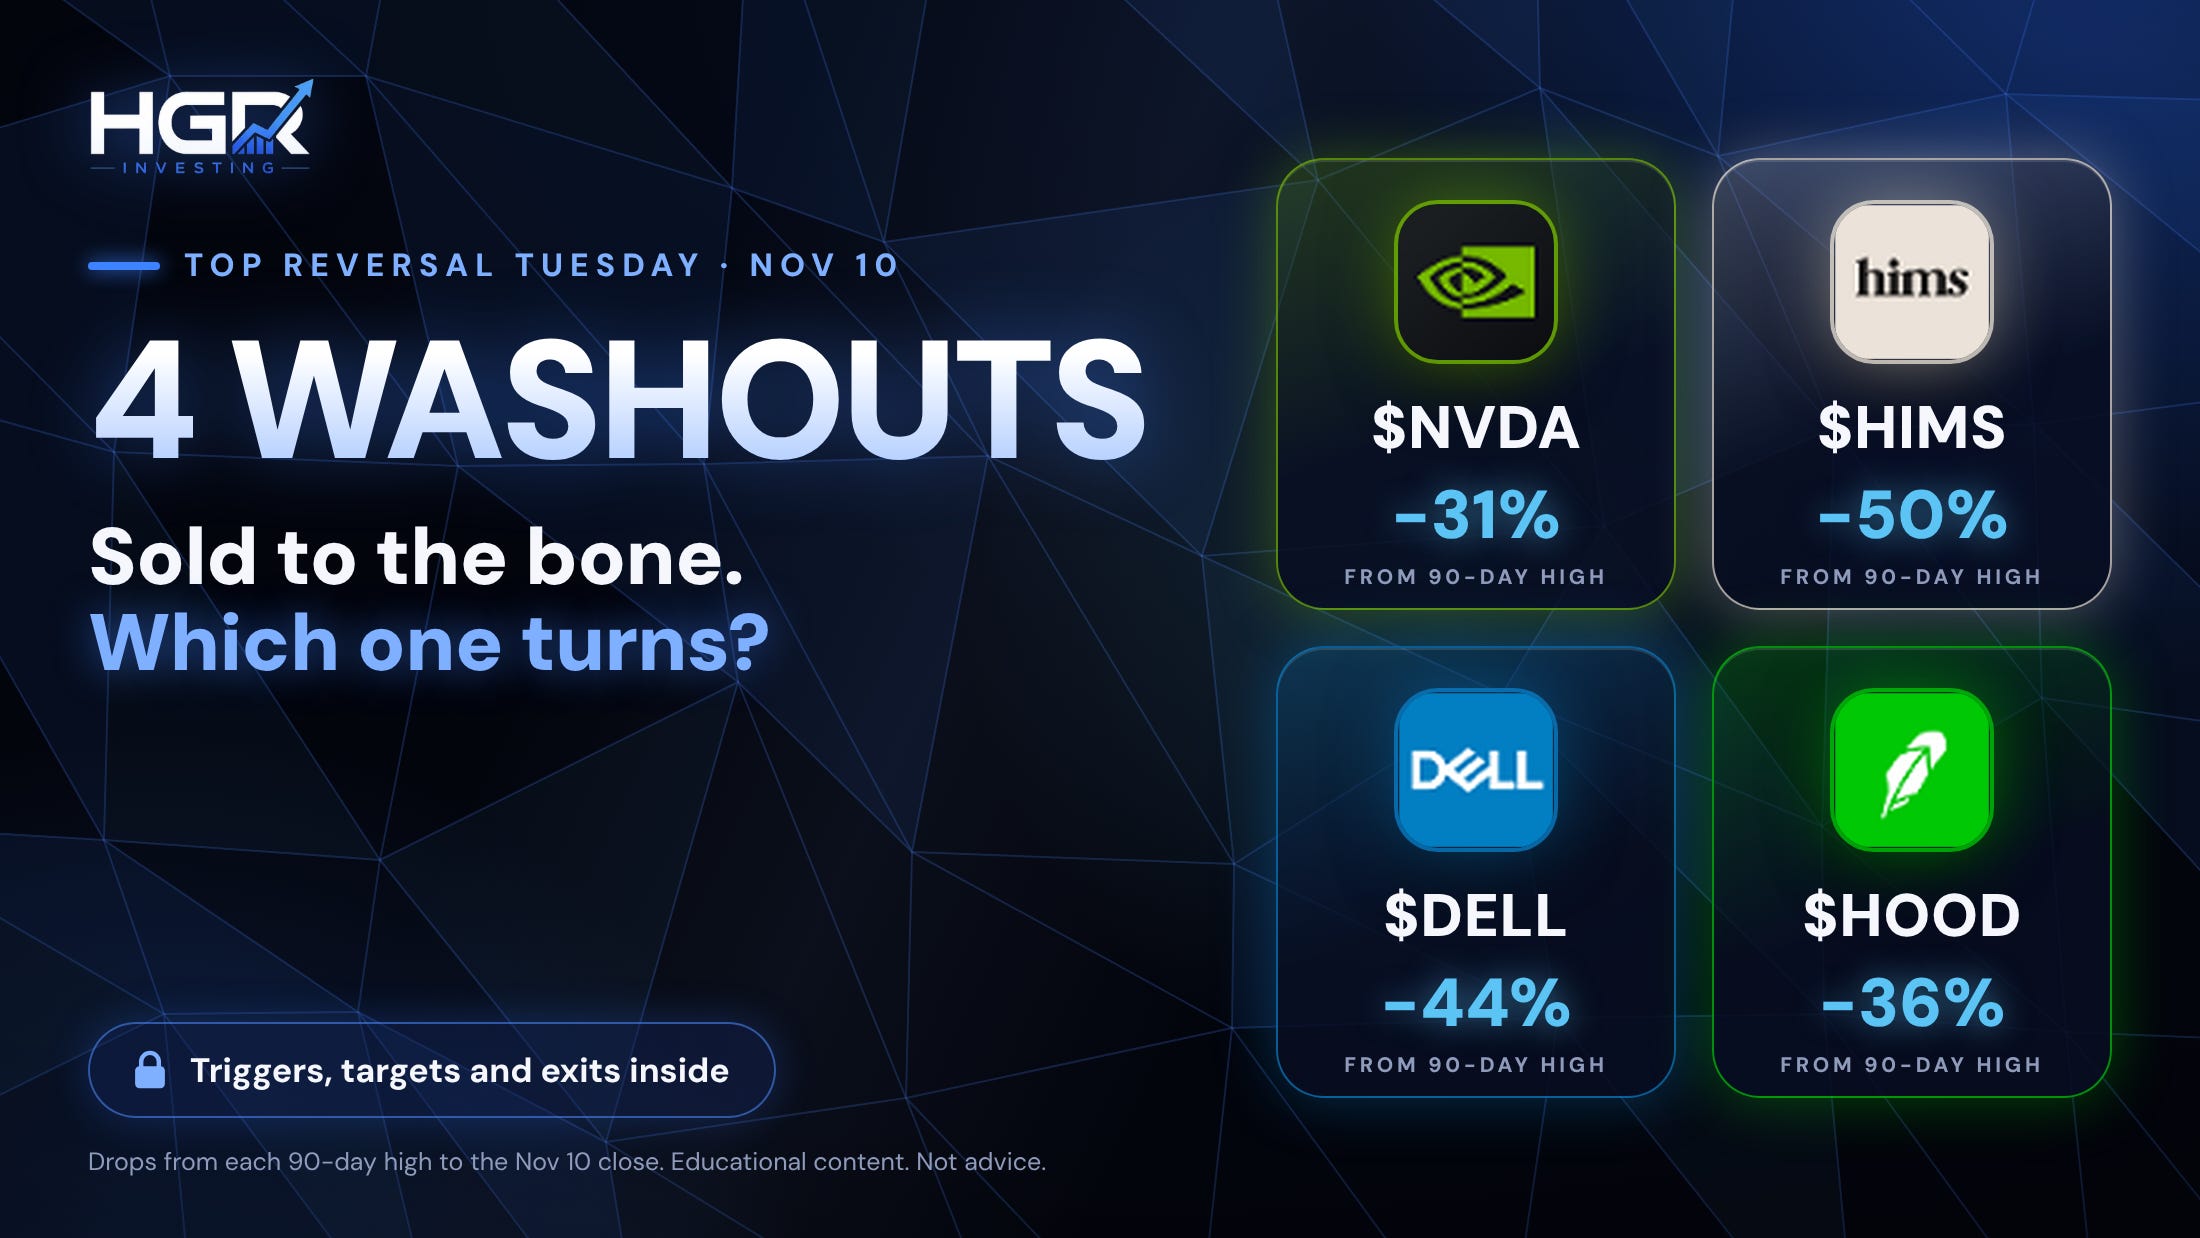
Every Tuesday we hunt for turning points in the stock market. 2 weeks ago we hit on everything and had one of our best weeks of the series, last week we had some close calls on price movement but mostly stayed out of the market with one trade triggering our stop loss. It happens, if anyone tells you it doesn’t they are lying. The fact that we implement stop losses and properly manage risk is more important than any other trading skill and allows us to allocate capital for the next play. Remember, there is always another trade. Three of our four setups never triggered, so anyone who followed the rules never took those trades. Sticking to the plan paid off bigtime: $XIFR is down 12.5% from the call, and $INTC fell as far as 14.9% below its call. The one setup that did trigger, $NBIX, sits 5.9% against us with its stop still in place.
This week our scan flagged four strategic bottoms with most of them being household names which is rare. Dips on large successful companies tend to reverse and ive marked out every level below. NVDA 0.00%↑ , HIMS 0.00%↑ , DELL 0.00%↑ and HOOD 0.00%↑ all fired five of nine exhaustion signals on the weekly chart. Each one sits 31% to 50% below its 90-day high. Before the new board, let’s grade last week’s.
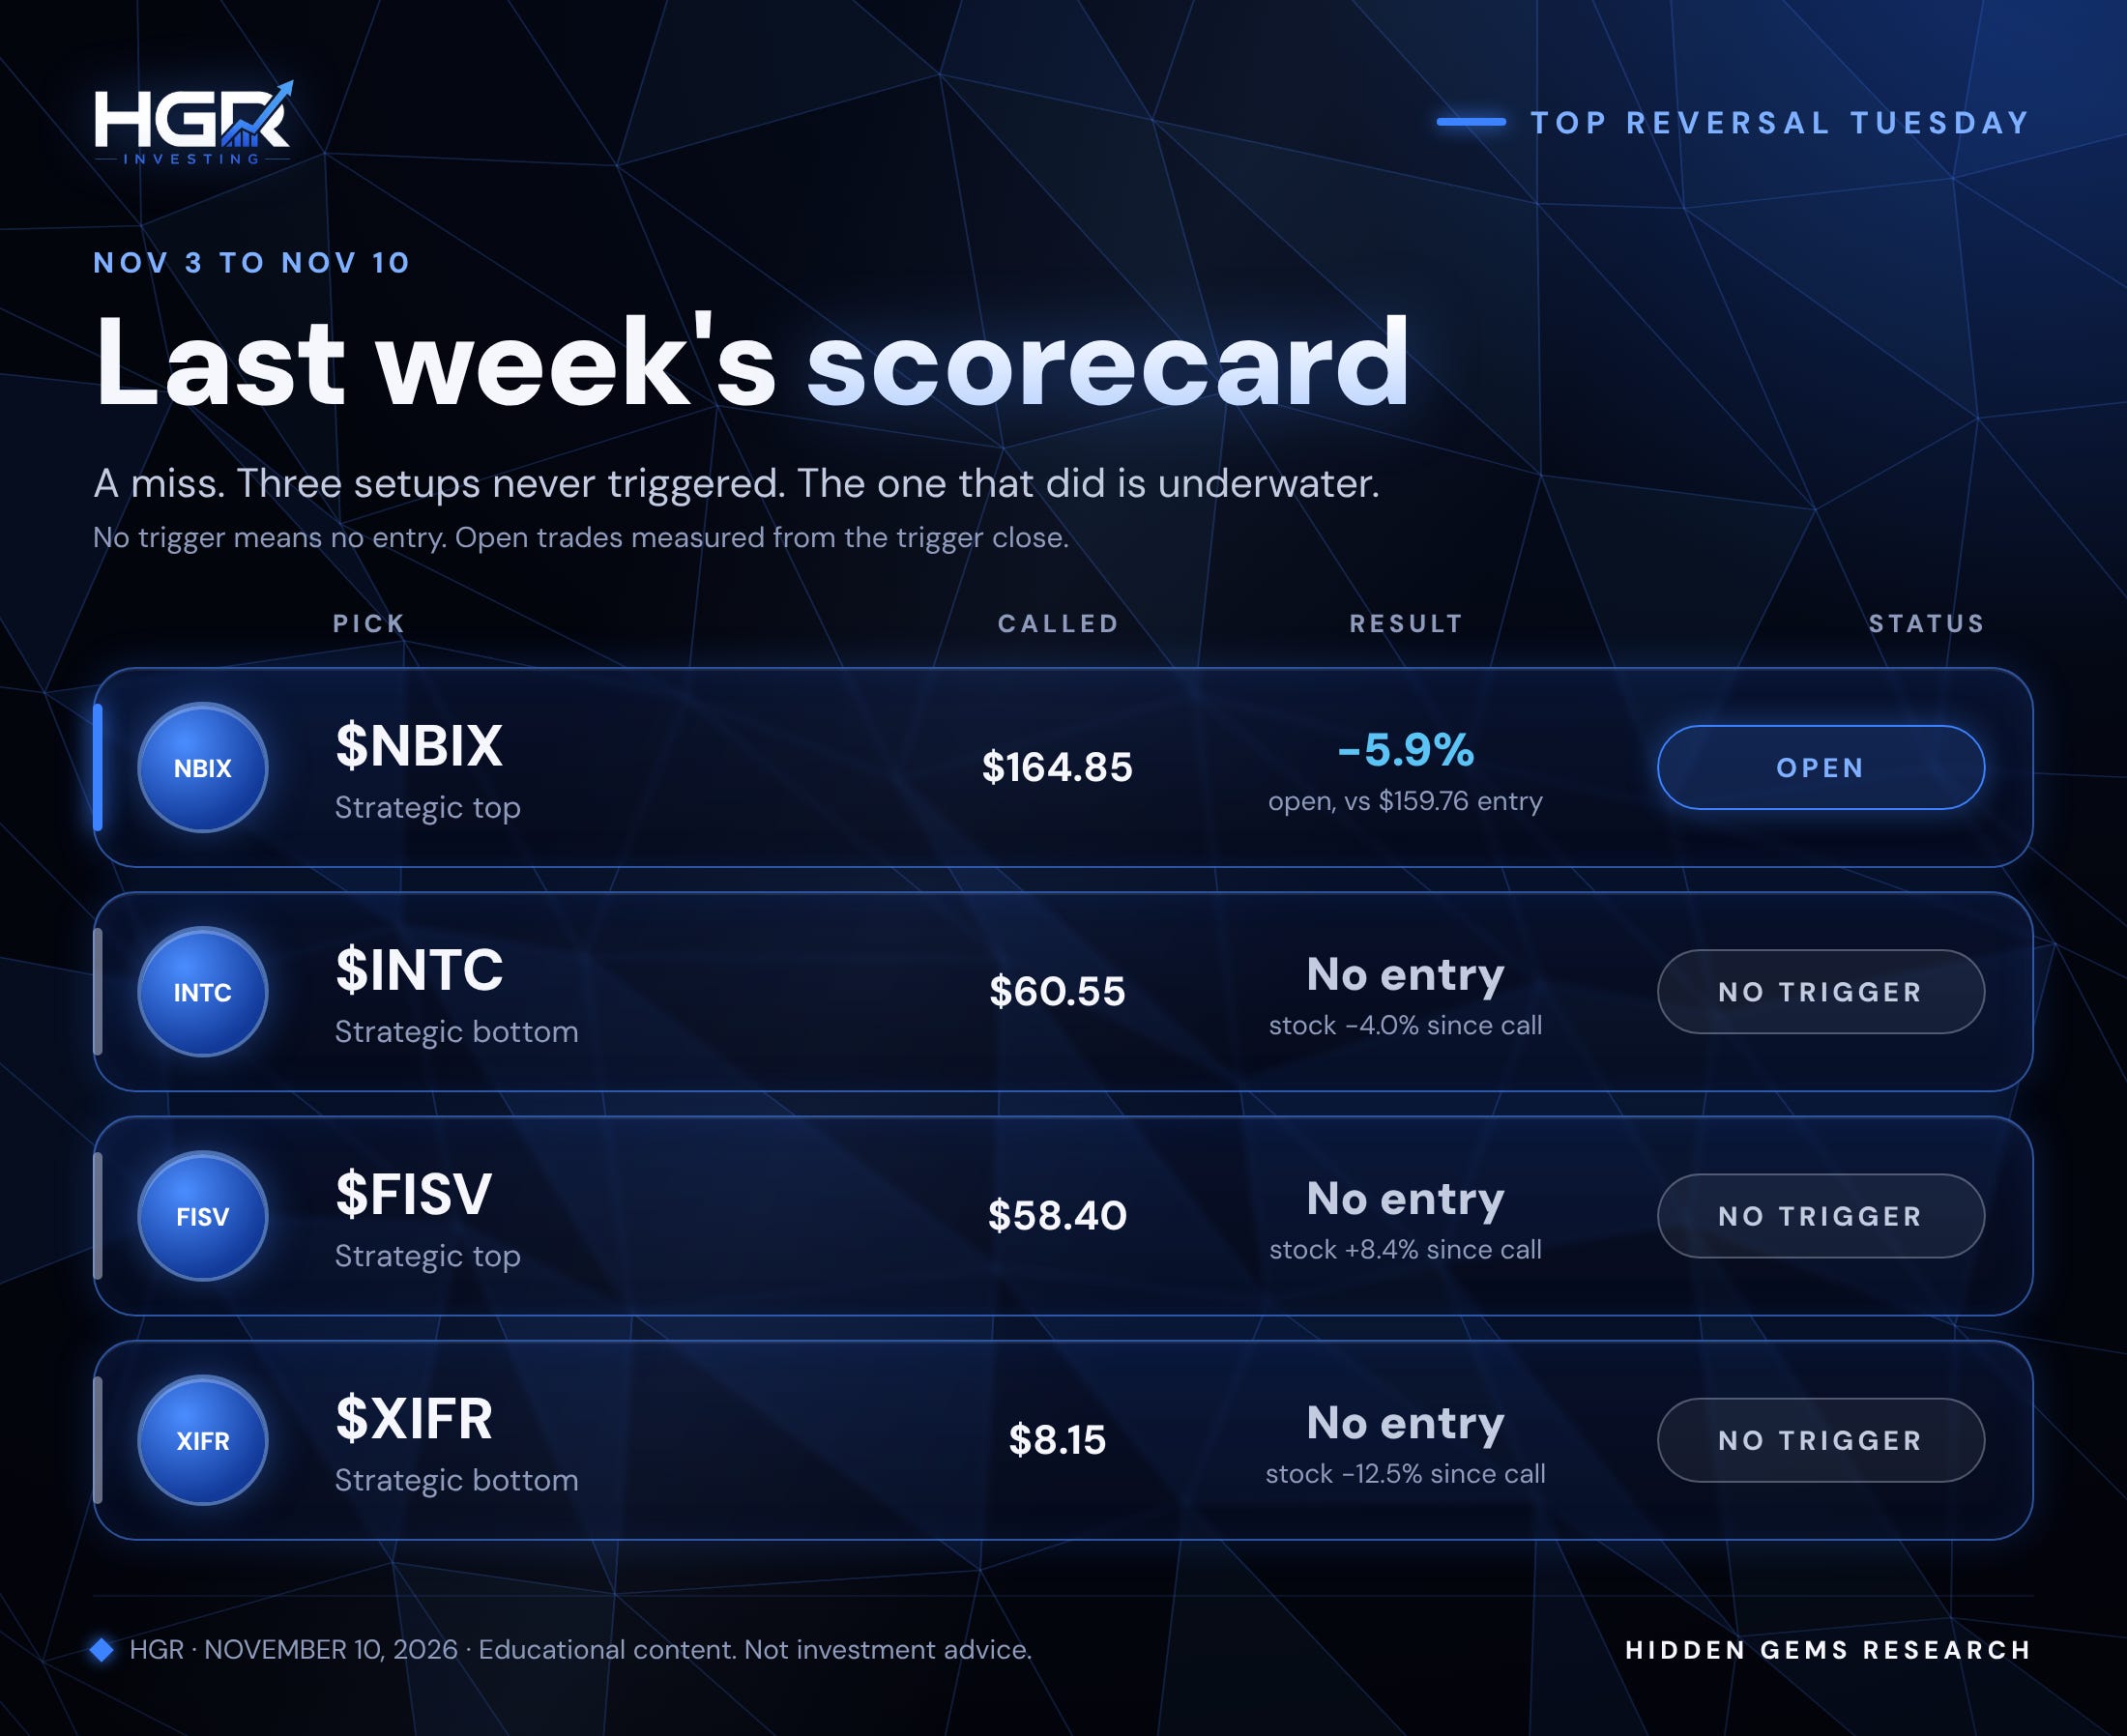
LAST WEEK’S SCORECARD
We called two bottoms and two tops on November 3. Every setup needed a daily close through its trigger before we leaned on it. Three never got that close. One did, and it turned on us. Two days later, on November 5, the S&P 500 fell 4.4% and the Nasdaq fell 5.5% in the post-midterm tech rout. This kind of rare price action broke most of the setups to our benefit. This is why we adhere to the plan instead of entering blind. Trading is a system. Here’s how each one played out.
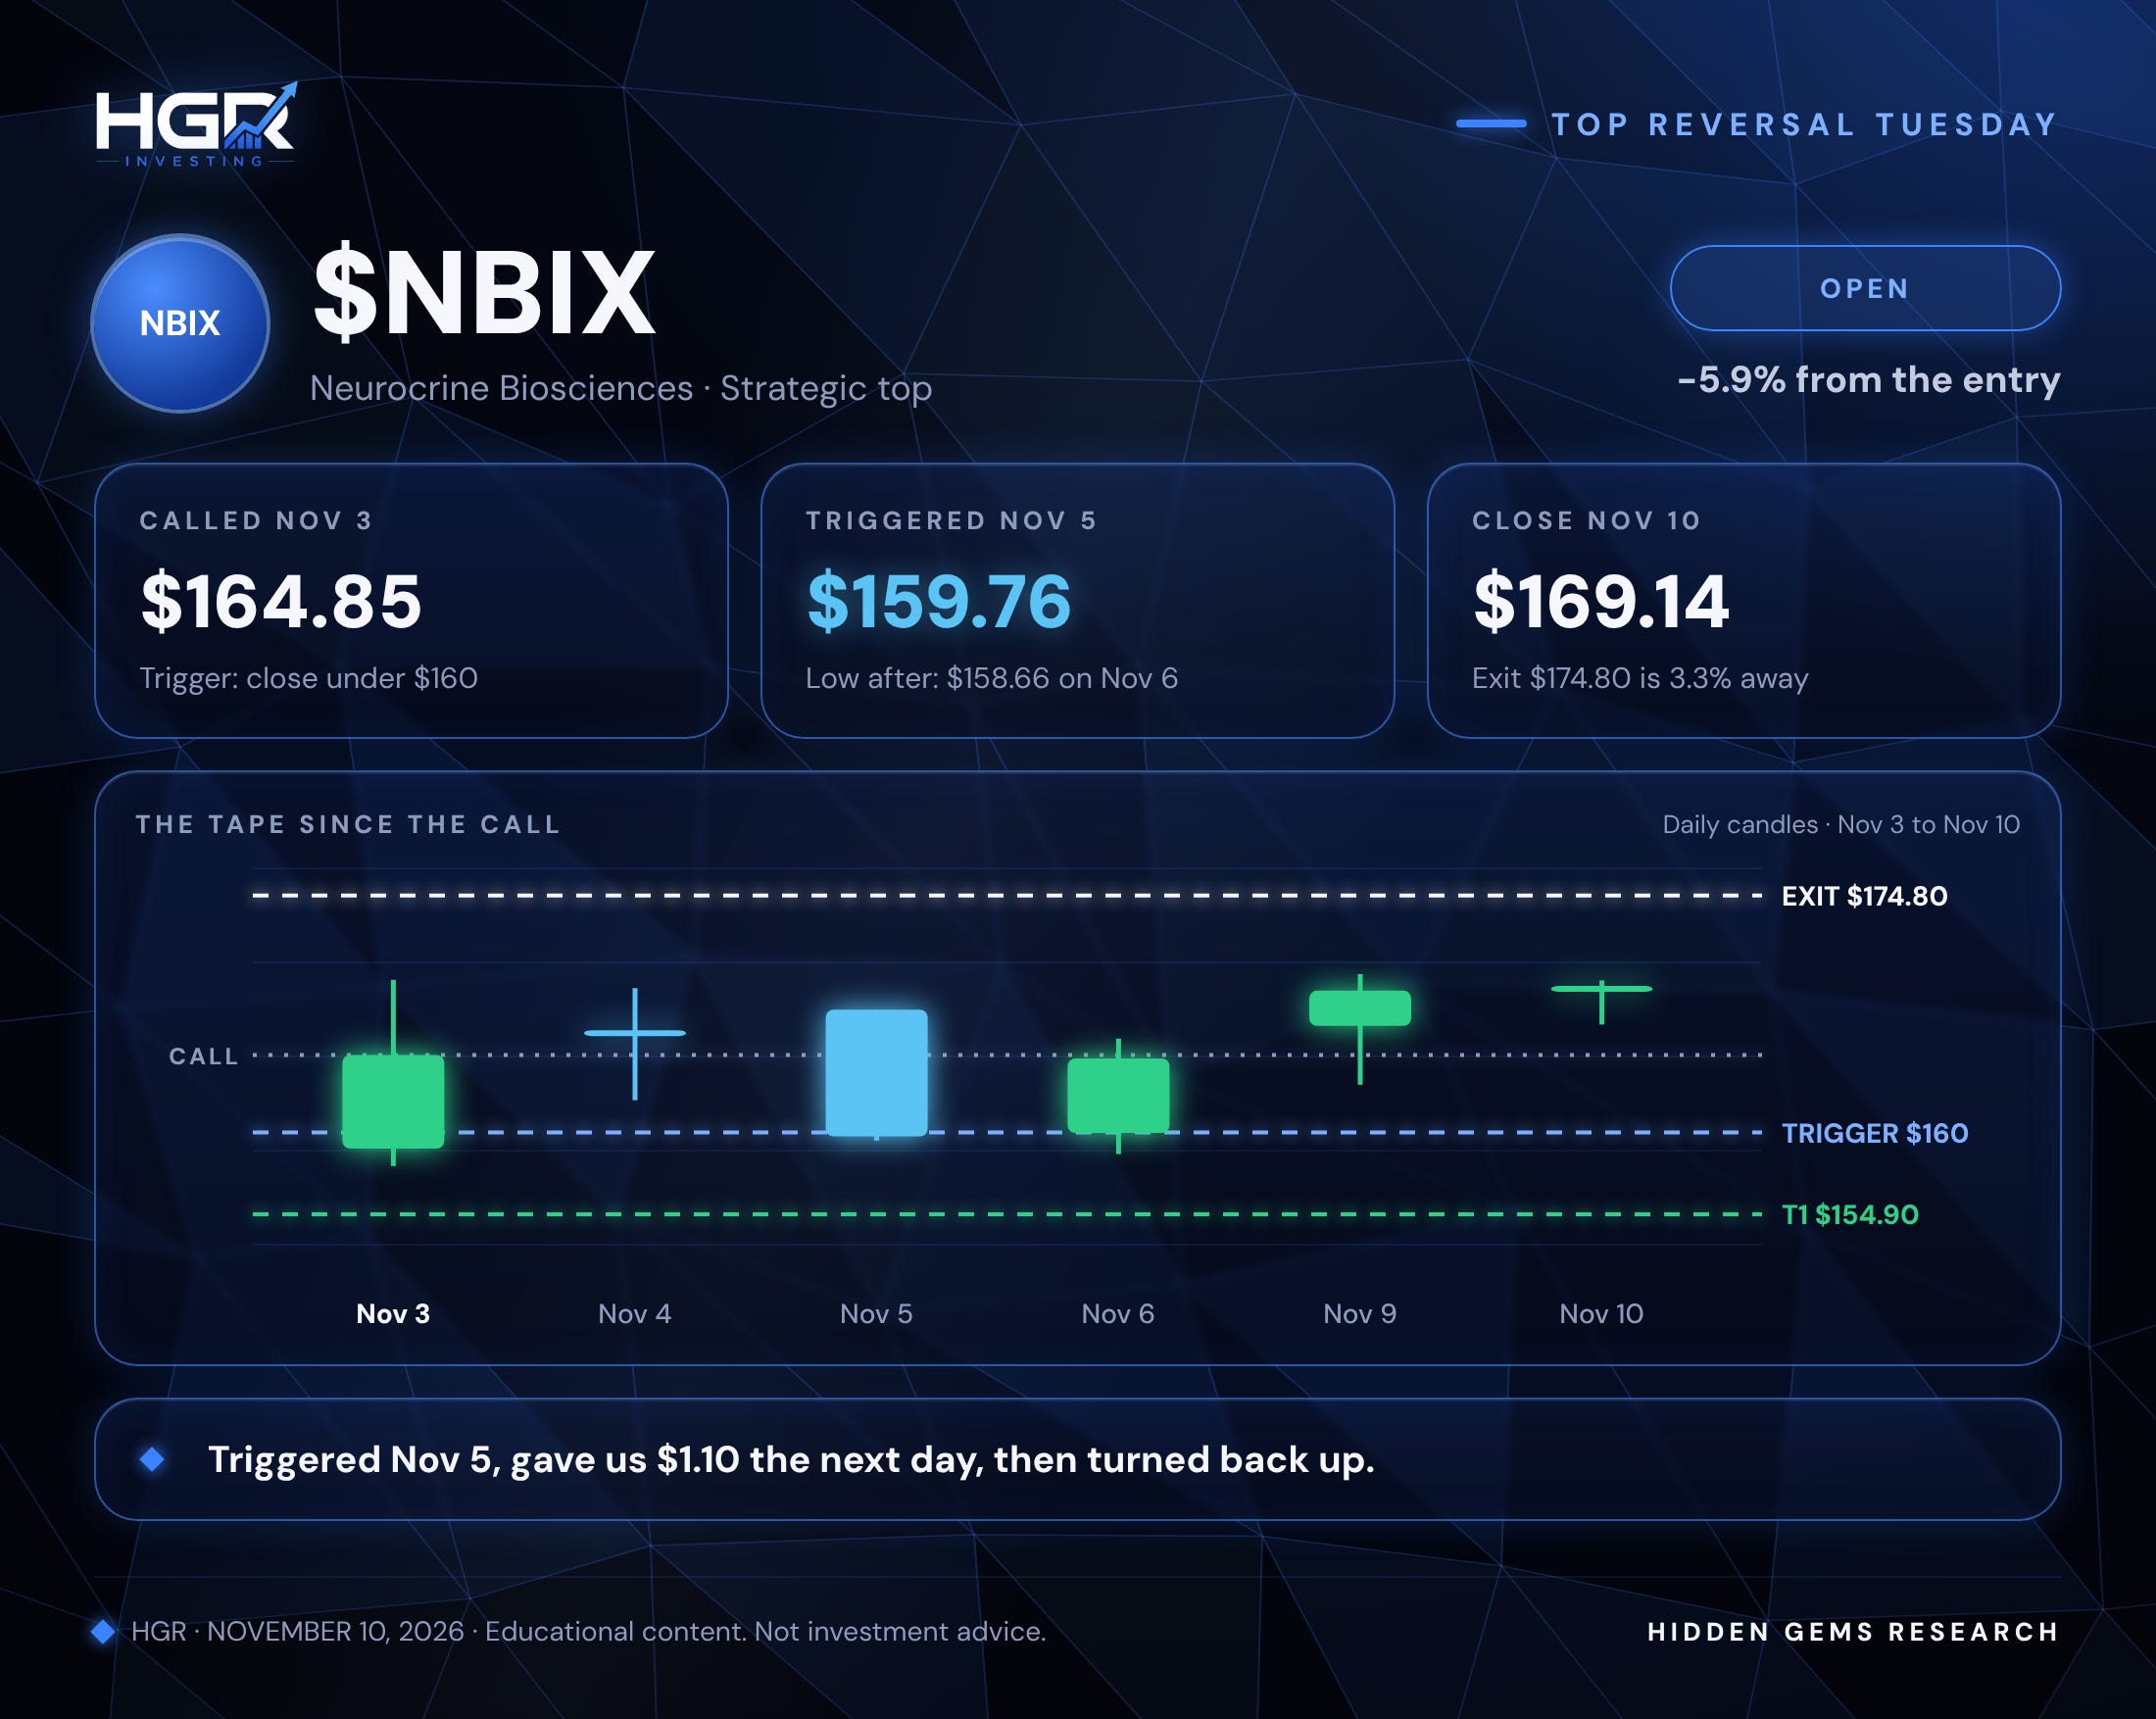
$NBIX triggered and is underwater. We called the top at $164.85 and asked for a close under $160. It gave us that on November 5 with a $159.76 close. The next day it dipped to $158.66, just $1.10 in our favor, then buyers took it back. It closed today at $169.14, 5.9% against the entry. The $174.80 exit sits 3.3% overhead, so the trade is still alive. The $154.90 first target never came close.
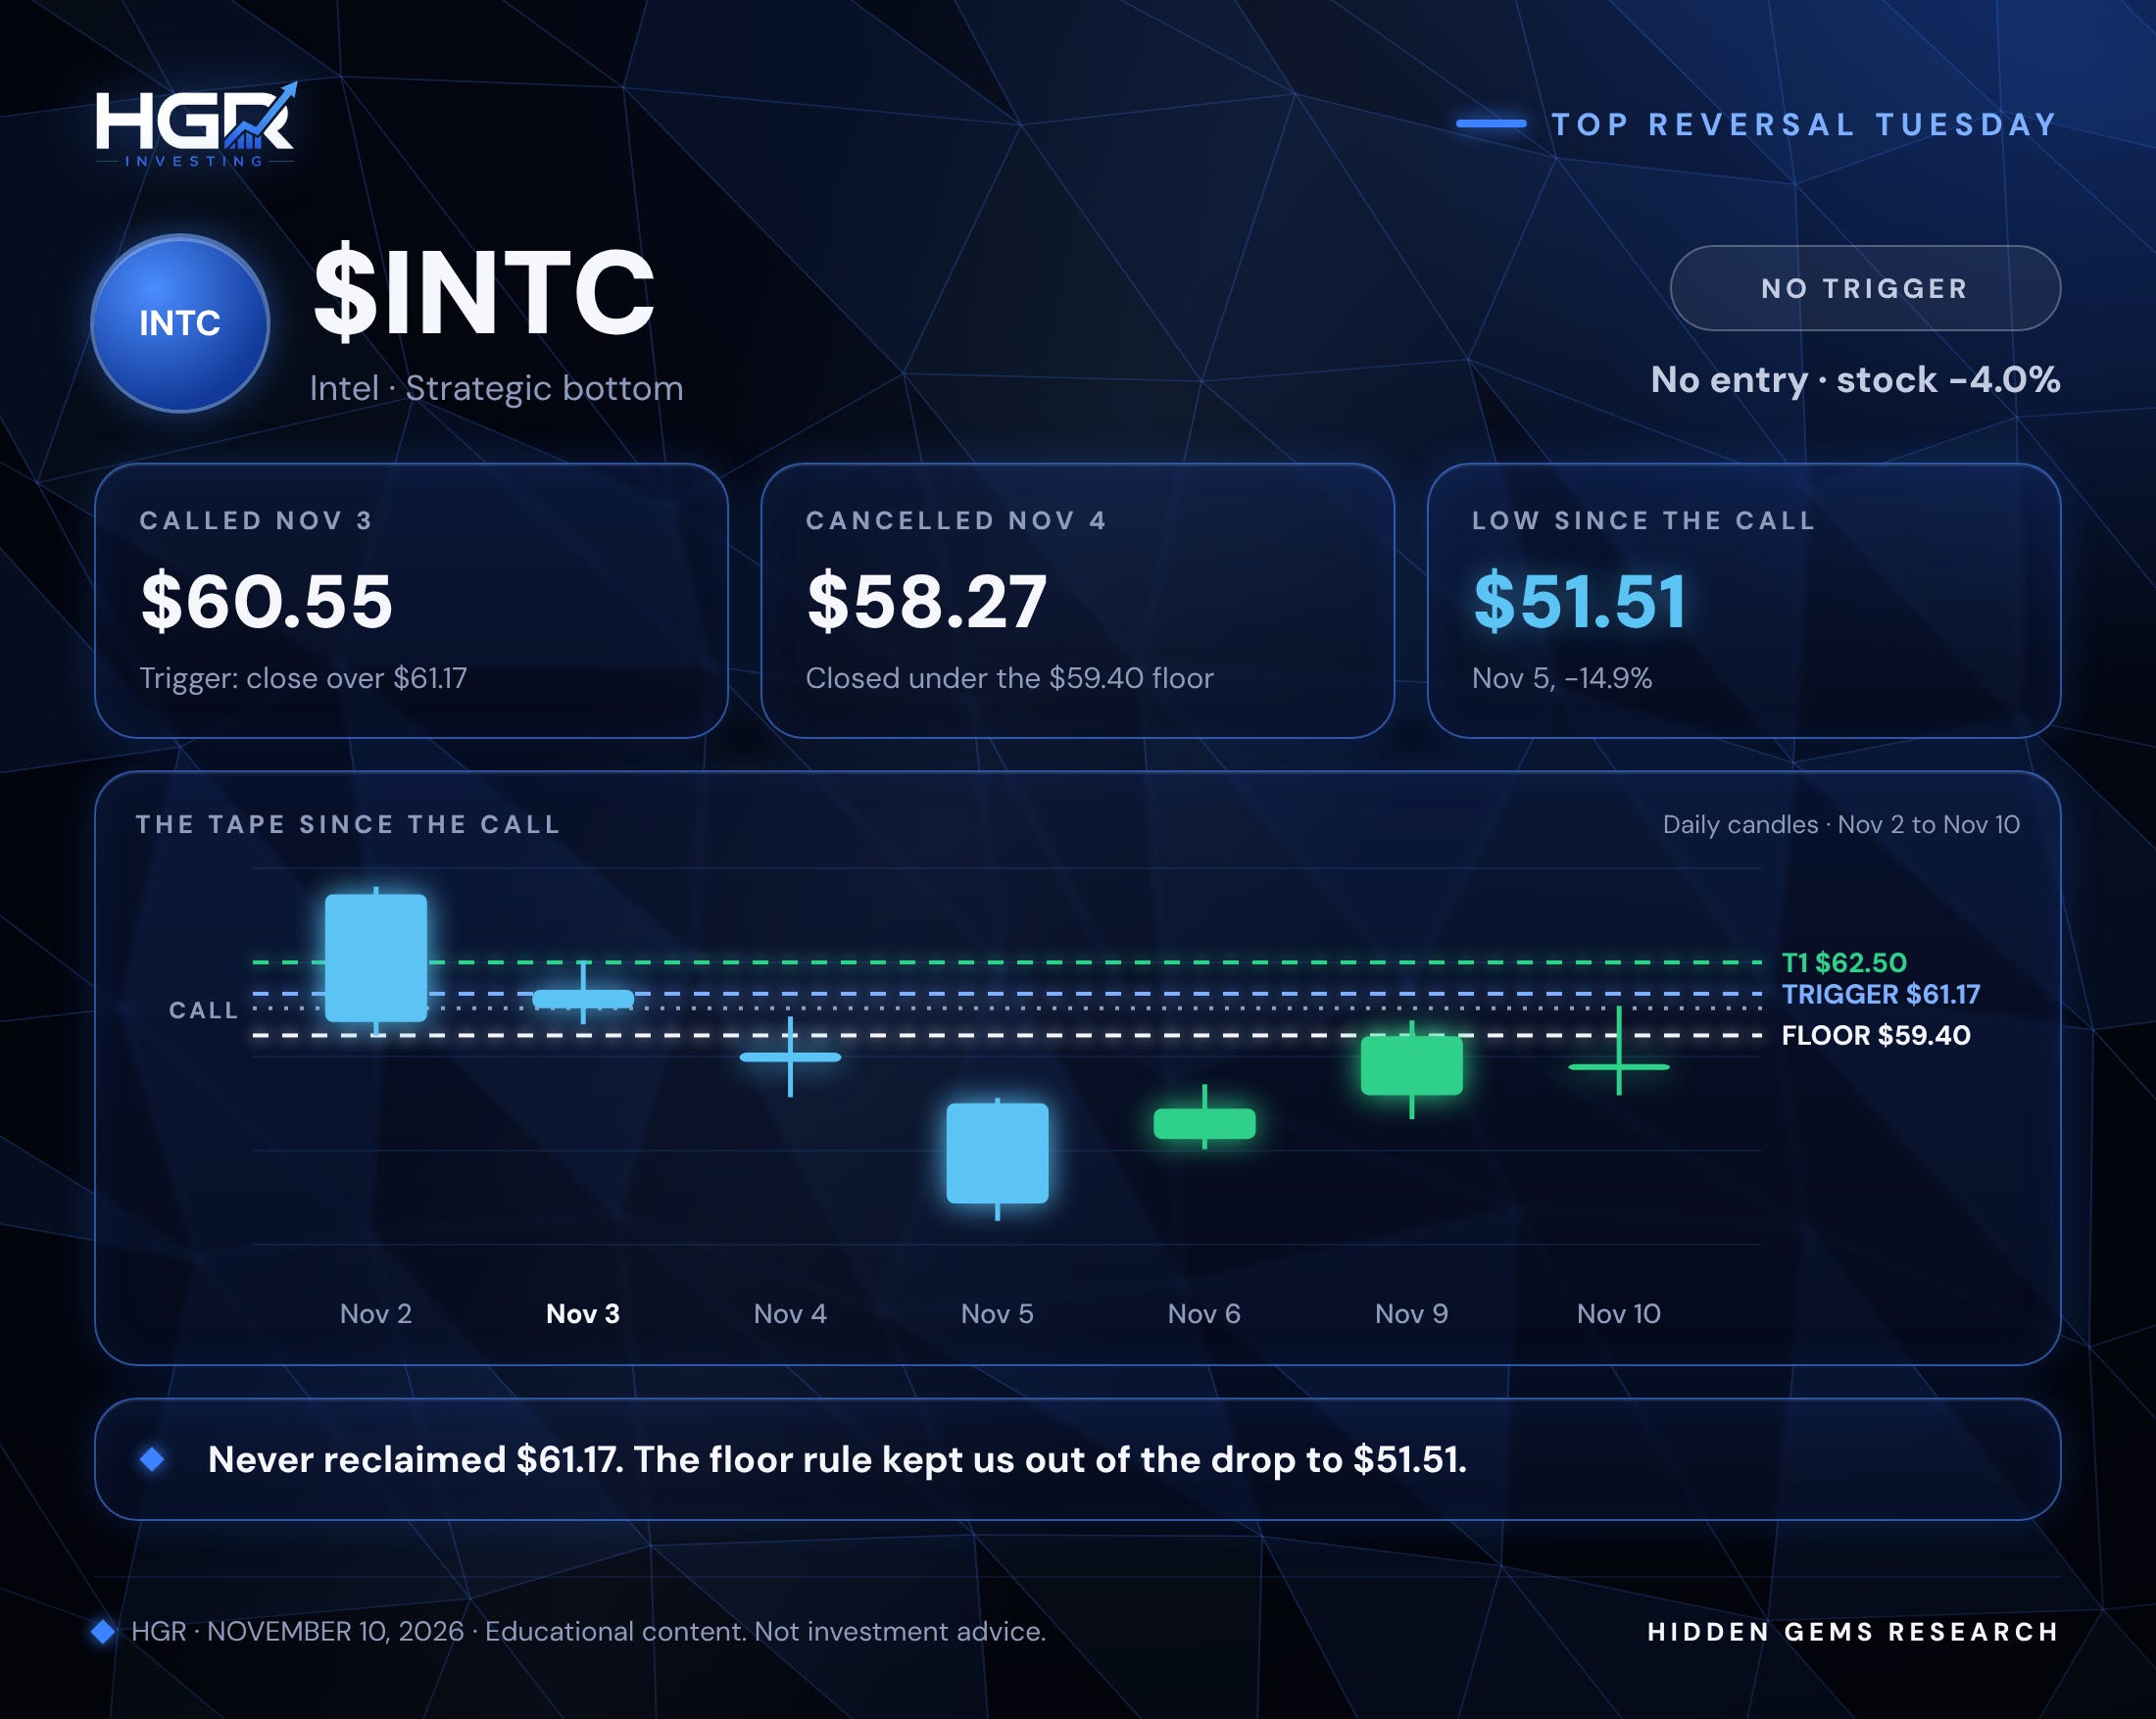
$INTC never triggered. We called the bottom at $60.55 and needed a close back over the $61.17 gamma flip. It never got there. Today’s $60.65 high came 52 cents short. Instead it closed at $58.27 on November 4, under the $59.40 floor, and that cancelled the setup. The next day it fell to $51.51, 14.9% under the call. The floor rule kept you out of that drop. It closed today at $58.13.
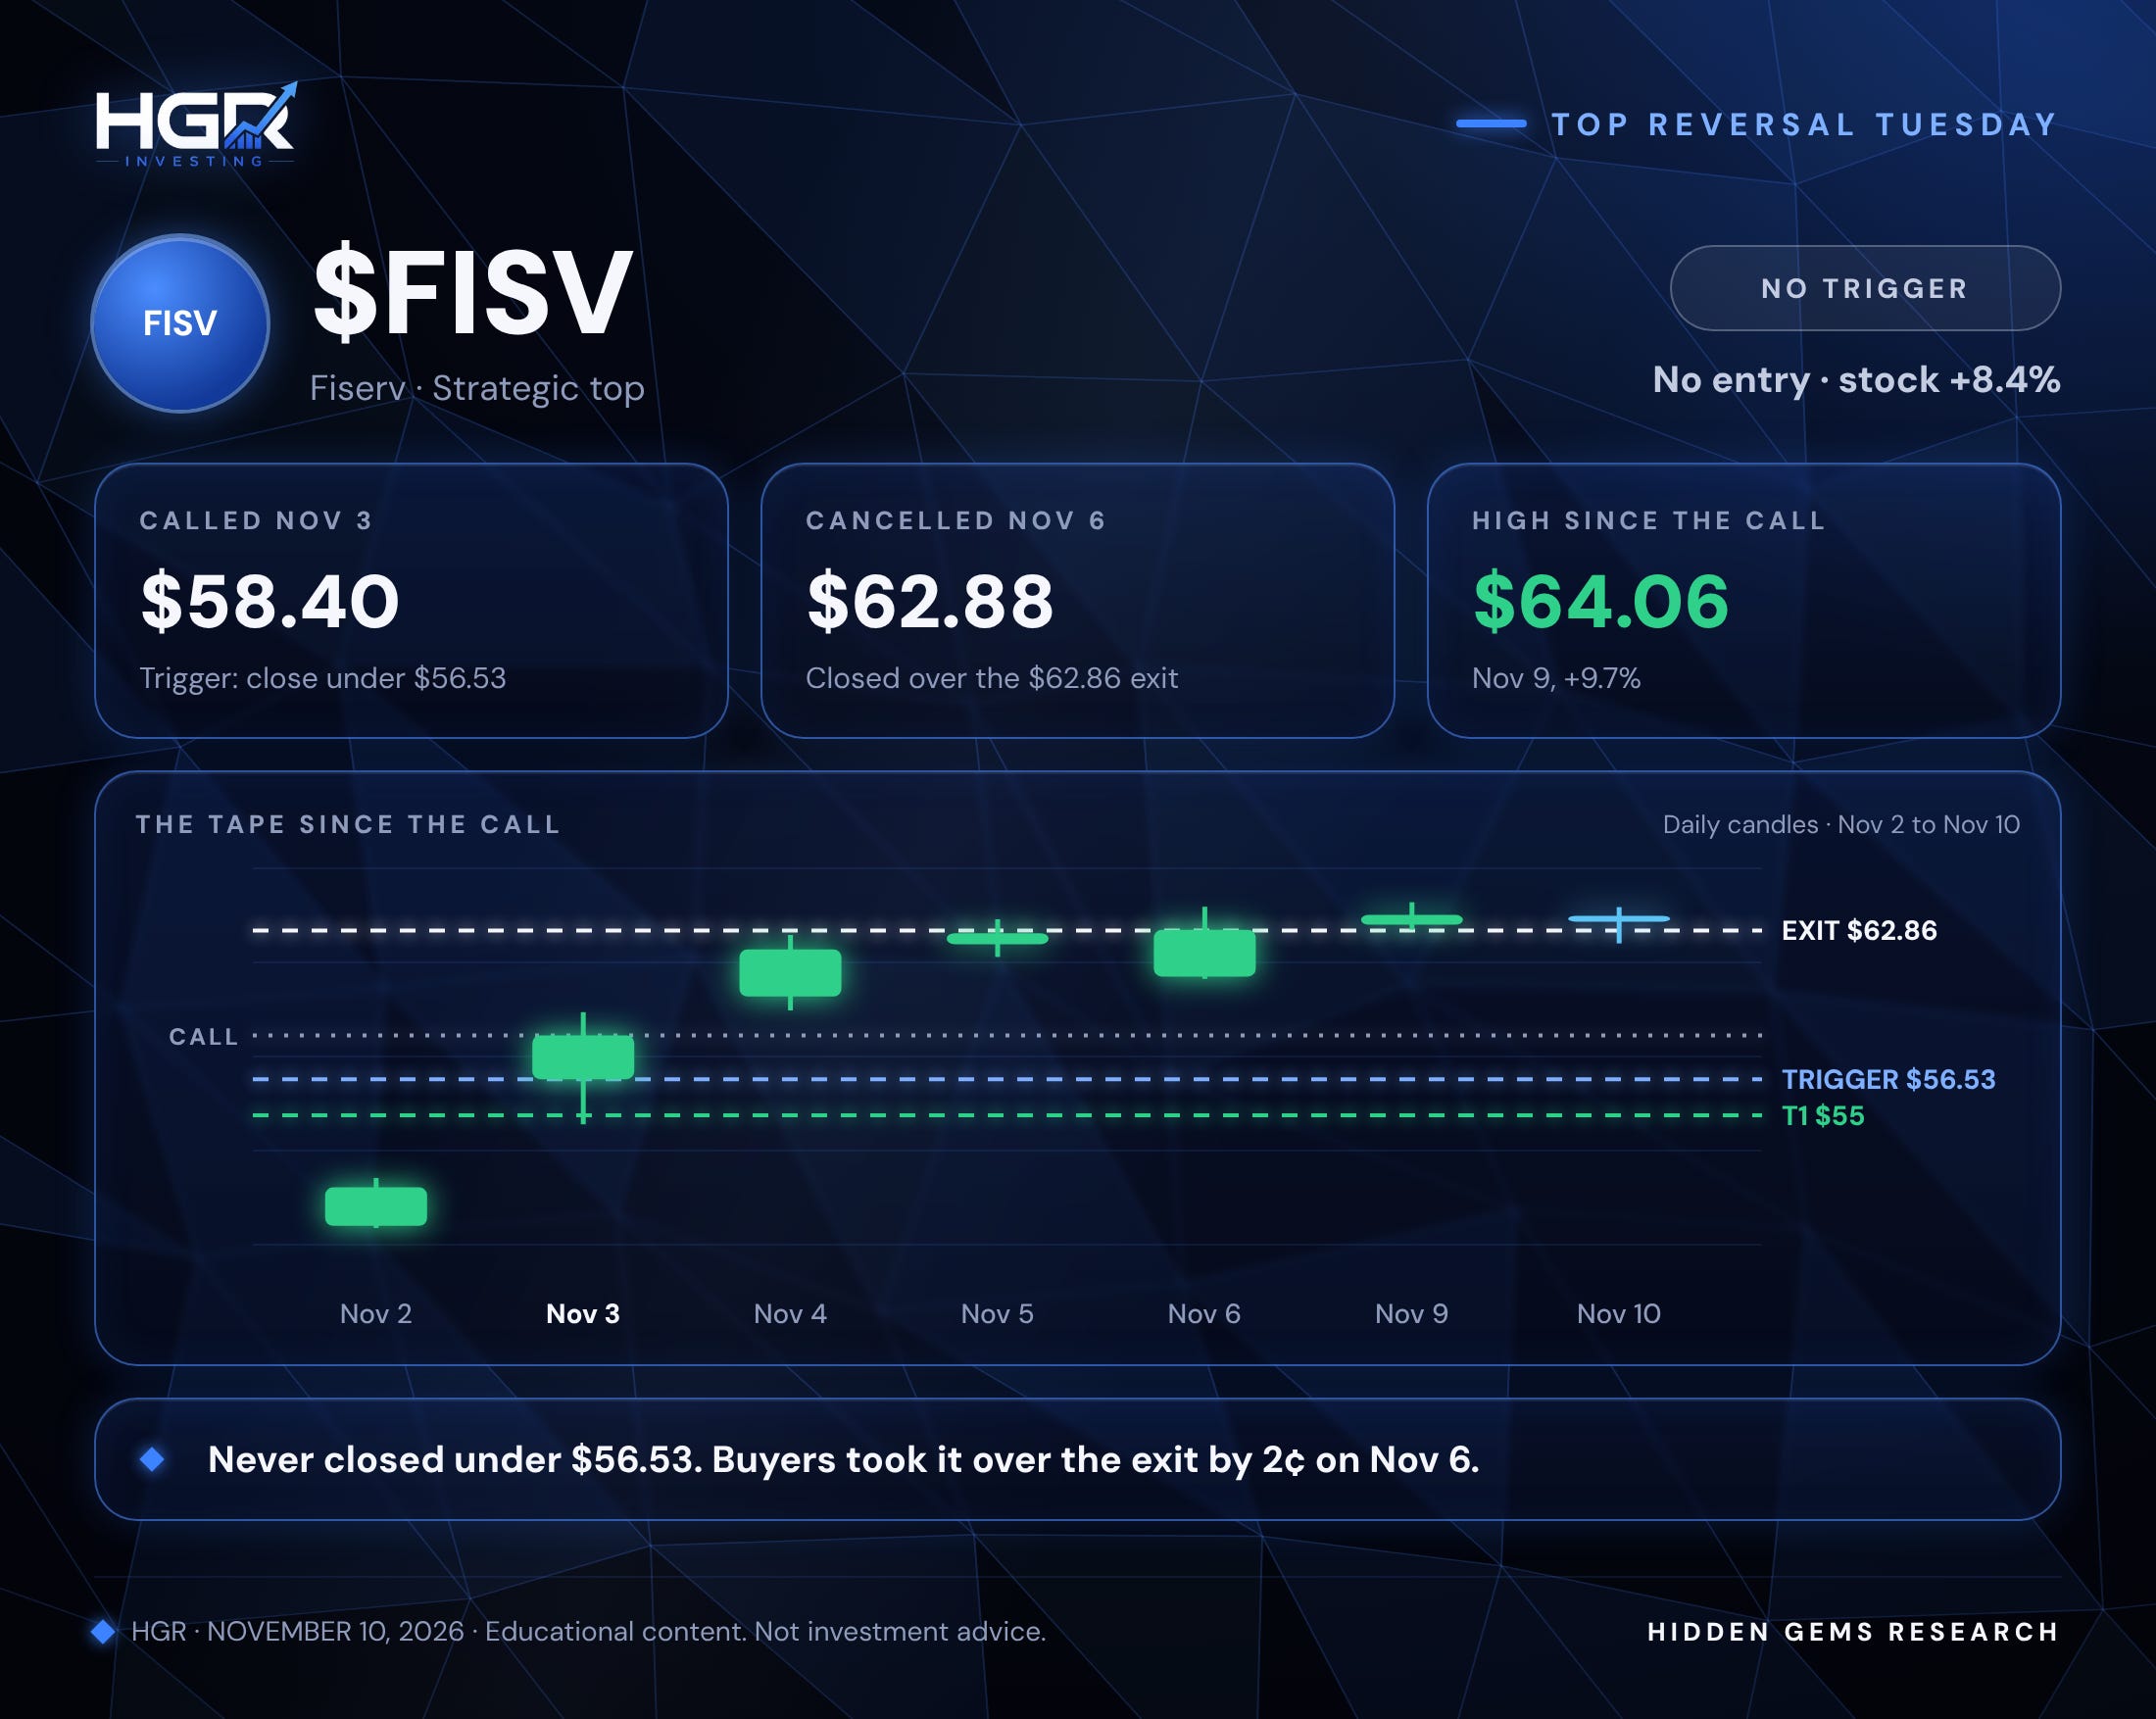
$FISV never triggered. We called the top at $58.40 and needed a close under $56.53. The lowest it got was $59.46. Buyers pushed it to a $62.88 close on November 6, two cents over the $62.86 exit, which cancelled the setup. It hit $64.06 on Monday and closed today at $63.32.
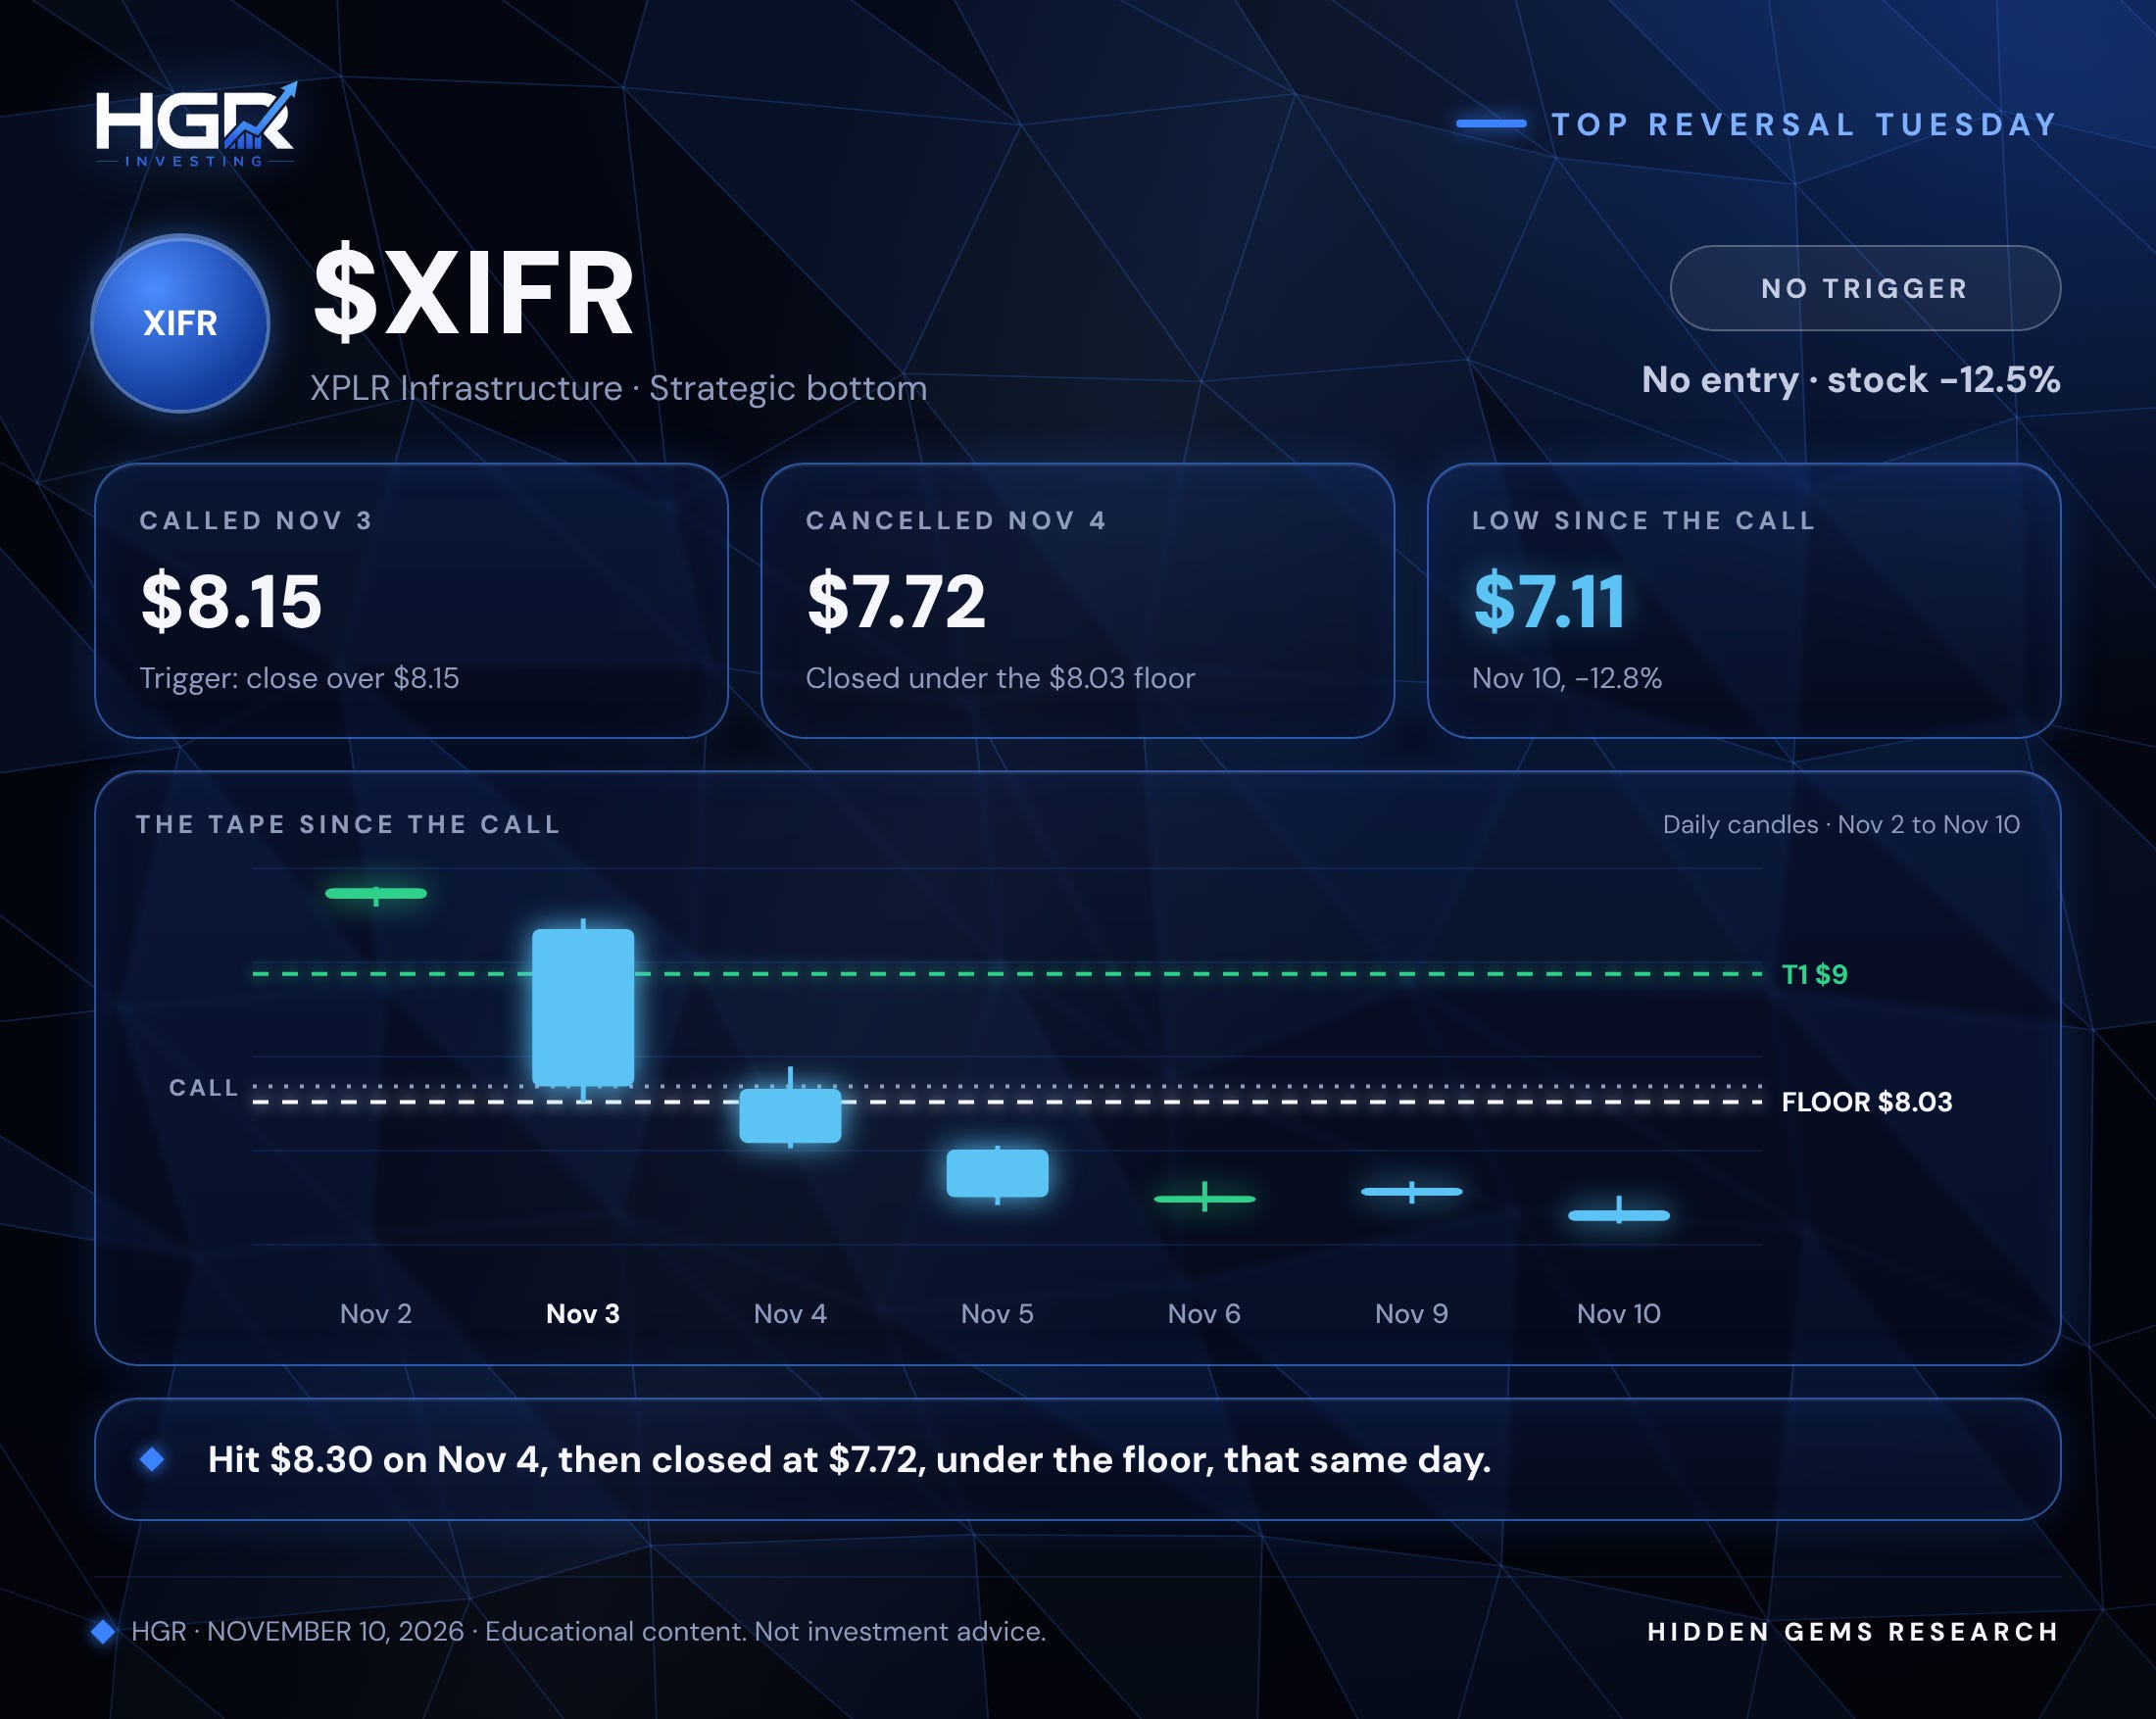
$XIFR never triggered. We called the bottom at $8.15 and needed a close above that level that held $8.03. On November 4 it traded up to $8.30, then closed at $7.72, under the floor, cancelling the setup. It slid to $7.11 today and closed at $7.13, 12.5% under the call. This one shows why I wait for the close. An intraday pop is not a reversal.
The elevated levels of volatility last week definitely played a roll in a quiet week for our set ups. The rules did their job: three bad reads cost nothing, and the one live trade still has its stop. That’s the point of a trigger and an invalidation. We’re coming back this week with some strong reversal candidates that look oversold in a market that should be recovering soon post midterms. Lets get into it.
THIS WEEK’S TAPE
A hot inflation print took the air out of Monday’s rally. The S&P 500 lost 0.38% to 7,520.93 and the Dow fell 0.30% to 52,231.89. The Nasdaq dropped 0.74% to 25,065.87, and the Russell 2000 gave up 0.7% to 2,821.38. The VIX eased to 19.46. October CPI rose 0.4% for the month against 0.3% expected. Core prices rose 0.3% against 0.2% expected. Traders now put about 84% odds on a quarter-point Fed hike in December, and the 10-year yield climbed to about 4.93%. Bitcoin slipped 2.1% to about $73,700, and gold futures fell more than 2%.
$NVDA dragged all three indexes lower. It fell 5.47% to $168.89 on 427 million shares, its second straight drop, as the fallout grew from reports about CEO Jensen Huang’s affair with an alleged Chinese intelligence asset. The board has opened an investigation, and Citi cut its price target to $285 from $315 while keeping a Buy rating. $HIMS fell 16.6% after a Q3 loss and a soft Q4 revenue guide.
This week’s board comes straight out of that pressure. Two names fell on their own news. Two fell with the AI and tech selloff that started after the midterms. All four now show the same weekly washout pattern, I lay out all four below.
UNLOCK THIS WEEK’S BOARD
2 weeks ago we had multiple double digit runners, last week the scan missed, and the trigger rules kept three of four bad reads from costing a dime. This week’s four bottoms sit below the line: I’ve laid out the floor, the trigger, the targets, and the exit plan for each one, plus the options structure I’d use on three of them. One reports earnings in seven days. Paid subscribers get the full board every Tuesday, plus a scorecard that grades every call, wins and misses alike. If you want the institutional data for yourself, head over to Trader Matrix with our HGR discount link.
